.NET Data VisualizationThe Best WPF Charting Library
ArticleRead more about the characteristics of the best WPF charting library.
Updated on October 24th, 2023 | Written by human
What is the best WPF charting library?
WPF (Windows Presentation Foundation) is a graphical subsystem in .NET for building Windows desktop applications. It provides rich graphical capabilities, allowing developers to create stunning and interactive user interfaces. One of the important aspects of WPF is charting, which helps developers to represent complex data in a visually appealing way.
There are several charting libraries available for WPF that make it easy to create charts and graphs. These libraries offer a wide range of chart types, including line charts, bar charts, pie charts, scatter charts, and more.
They also provide advanced features such as data binding, animations, and custom styling, making it possible to create charts that fit the look and feel of the application. With these libraries, developers can easily add charts to their WPF applications and make their data more understandable to users.
LightningChart .NET is widely considered as the best WPF charting library due to its advanced features and performance. It is a high-performance charting library designed specifically for WPF, and it provides a wide range of chart types, including line charts, bar charts, pie charts, and more.
With LightningChart .NET, developers can create stunning and interactive charts with ease, and the library provides a rich set of features to customize the charts to fit the look and feel of their applications.
One of the standout features of LightningChart .NET is its performance. The library is optimized for high-speed data visualization, and it can handle large amounts of data in real-time. This makes it an ideal choice for applications that require fast and responsive charting, such as financial, scientific, and engineering applications.
Furthermore, LightningChart .NET supports real-time data streaming, which allows developers to create dynamic charts that update in real time, providing users with up-to-date information at all times.
Additionally, the library provides a user-friendly API that makes it easy for developers to get started, and it comes with a range of tutorials, examples, and documentation to help developers make the most of its capabilities.
WPF (Windows Presentation Foundation) is a graphical subsystem in .NET for building Windows desktop applications.
It provides rich graphical capabilities, allowing developers to create stunning and interactive user interfaces.
One of the important aspects of WPF is charting, which helps developers to represent complex data in a visually appealing way.
There are several charting libraries available for WPF that make it easy to create charts and graphs.
These libraries offer a wide range of chart types, including line charts, bar charts, pie charts, scatter charts, and more.
They also provide advanced features such as data binding, animations, and custom styling, making it possible to create charts that fit the look and feel of the application.
With these libraries, developers can easily add charts to their WPF applications and make their data more understandable to users.
LightningChart .NET is widely considered as the best WPF charting library due to its advanced features and performance.
It is a high-performance charting library designed specifically for WPF, and it provides a wide range of chart types, including line charts, bar charts, pie charts, and more.
With LightningChart .NET, developers can create stunning and interactive charts with ease, and the library provides a rich set of features to customize the charts to fit the look and feel of their applications.
One of the standout features of LightningChart .NET is its performance.
The library is optimized for high-speed data visualization, and it can handle large amounts of data in real time.
This makes it an ideal choice for applications that require fast and responsive charting, such as financial, scientific, and engineering applications.
Furthermore, LightningChart .NET supports real-time data streaming, which allows developers to create dynamic charts that update in real-time, providing users with up-to-date information at all times.
Additionally, the library provides a user-friendly API that makes it easy for developers to get started, and it comes with a range of tutorials, examples, and documentation to help developers make the most of its capabilities.
XY Charts for WPF
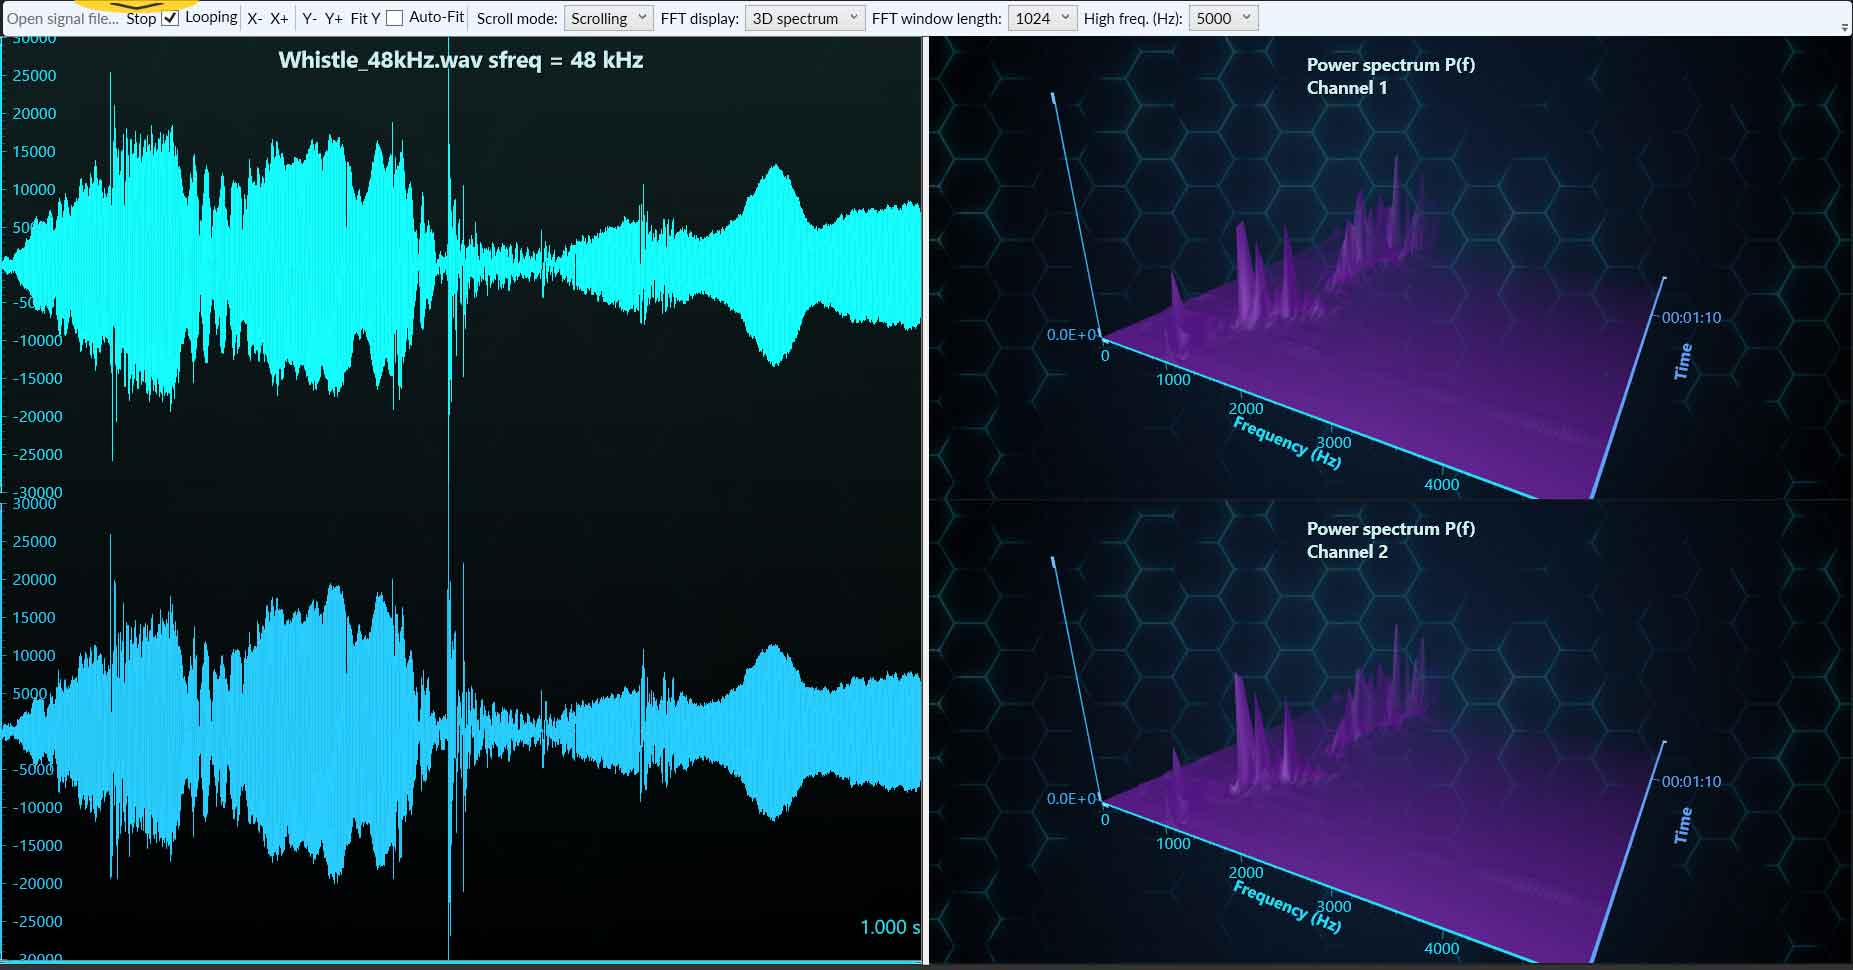
These are the most definitive 2D cartesian charts with the best rendering performance in the industry (embedded DirectX hardware and software acceleration).
What makes a library the best WPF charting library, are the capabilities to visualize your complex and huge data sets with optimized series types, shared X & Y axes, built-in real-time scrolling modes, and industry-leading configuration options. This can be achieved with LightningChart .NET.
For instance, numerous chart types can be created and the most challenging interactive logic can be implemented as well. Here’s an overview of our library’s main characteristics:
- Series types: sampled data (discrete signal), digital/binary data, line, scatter points, point-line, freeform point-line, areas, high-low, polygon, stock (OHLC, candle-stick), bar, band, constant line, line collection, intensity grid, intensity mesh.
- All different series types could be combined together in the same chart, which may have geographical maps underneath.
- Real-time monitoring scrolling modes: scrolling, sweeping*, stepping, oscilloscope style level triggered.
- Individual line segment and point coloring, error bars in vertical and horizontal directions.
- Data-breaking and clip areas to exclude some of the data.
- Different line styles and countless point shapes.
- Heatmaps with contour lines, wireframes, and contour labels.
- Stencil for rendering intensity series inside a polygon or a map region.
- Annotations, markers, data cursors.
- Persistent rendering layers – for fading trace history or accumulated hit effect.
- Several legend boxes are supported within the same chart.
- Unlimited number of Y- and X-axes, linear and logarithmic axes, and X-axis scale breaks.
- Several configurable vertical segments in the chart, layered/stacked/segmented.
- Dozens of properties to control zooming and panning behavior.
- Point, line, or grid node tracking functionality.
*Notice that sweeping mode is built-in; no other charting provider has this.
These are the most definitive 2D cartesian charts with the best rendering performance in the industry (embedded DirectX hardware and software acceleration).
What makes a library the best WPF charting library, are the capabilities to visualize your complex and huge data sets with optimized series types, shared X & Y axes, built-in real-time scrolling modes, and industry-leading configuration options. This can be achieved with LightningChart .NET.
For instance, numerous chart types can be created and the most challenging interactive logic can be implemented as well.
Here’s an overview of our library’s main characteristics:
- Series types: sampled data (discrete signal), digital/binary data, line, scatter points, point-line, freeform point-line, areas, high-low, polygon, stock (OHLC, candle-stick), bar, band, constant line, line collection, intensity grid, intensity mesh.
- All different series types could be combined together in the same chart, which may have geographical maps underneath.
- Real-time monitoring scrolling modes: scrolling, sweeping*, stepping, oscilloscope style level triggered.
- Individual line segment and point coloring, error bars in vertical and horizontal directions.
- Data-breaking and Clip-areas to exclude some of the data.
- Different line styles and countless point shapes.
- Heatmaps with contour lines, wireframes, and contour labels.
- Stencil for rendering intensity series inside a polygon or a map region.
- Annotations, markers, data cursors.
- Persistent rendering layers – for fading trace history or accumulated hit effect.
- Several legend boxes are supported within the same chart.
- Unlimited number of Y- and X-axes, linear and logarithmic axes, and X-axis scale breaks.
- Several configurable vertical segments in the chart, layered/stacked/segmented.
- Dozens of properties to control zooming and panning behavior.
- Point, line, or grid node tracking functionality.
*Notice that sweeping mode is built-in; no other charting provider has this.
Trader Charts
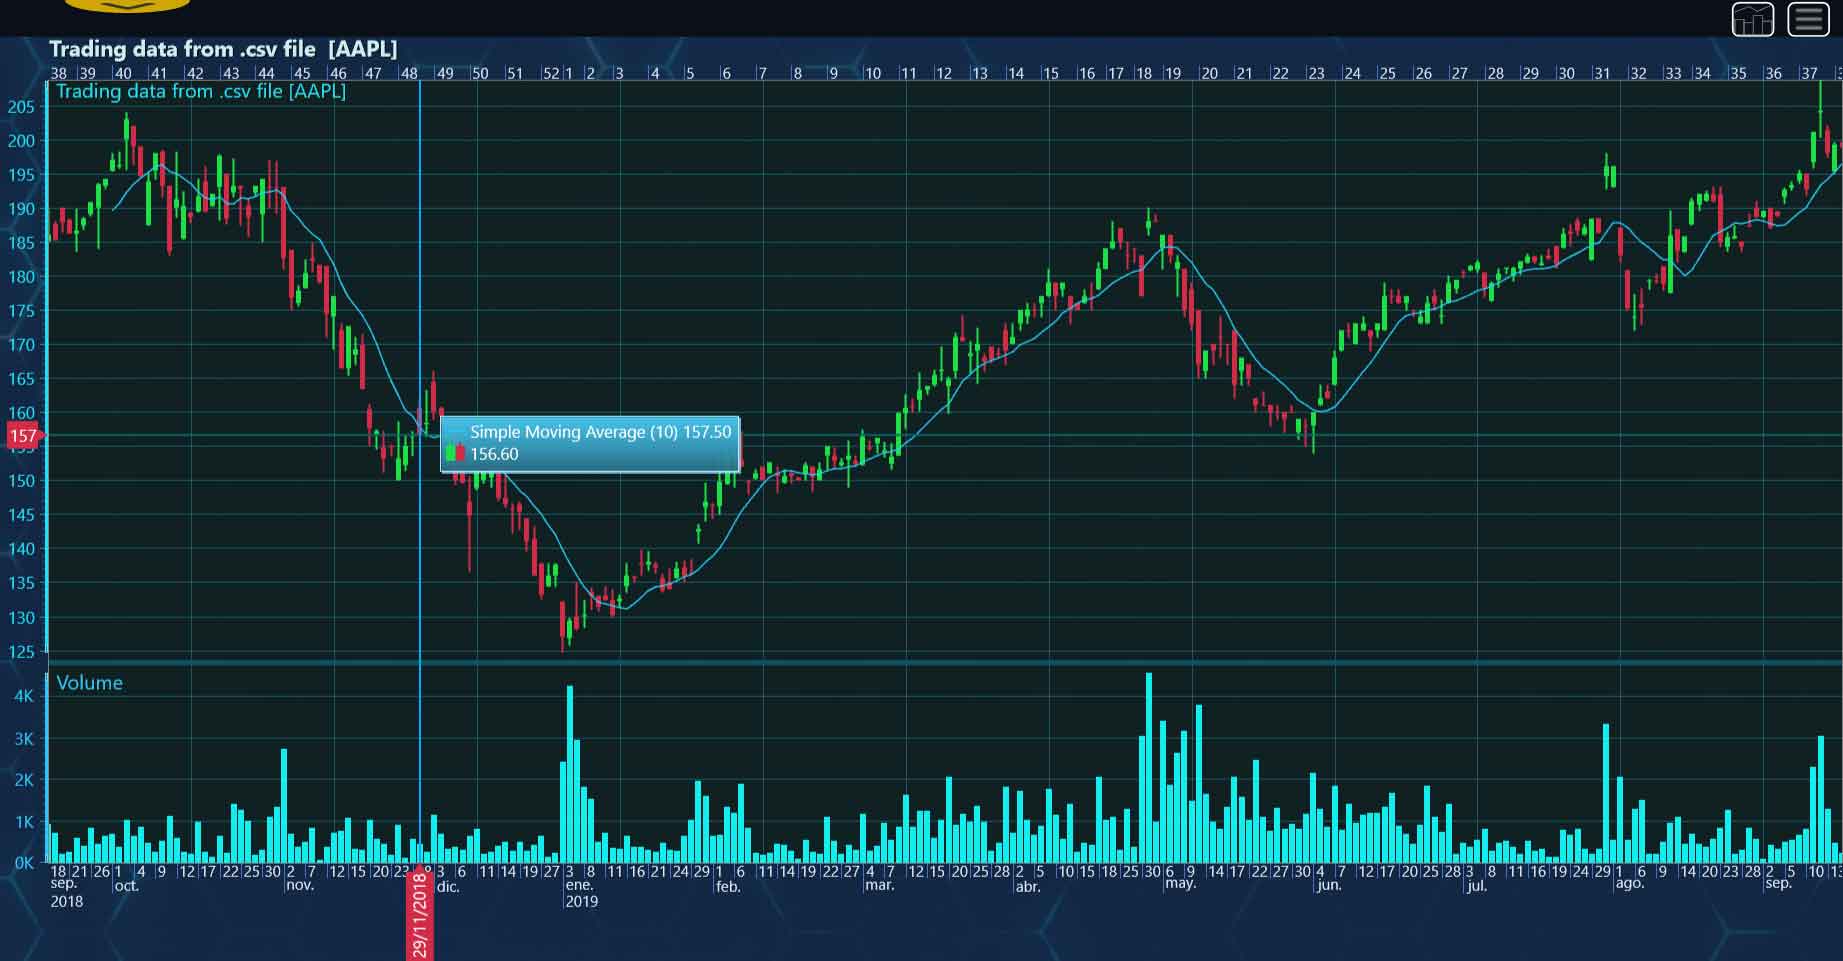
These are easy-to-use, easy-to-integrate, trading charts with Technical Indicators and Drawing Tools. This is the easiest approach for making apps for Trading & Technical Analysis.
- The Trader library is built over the LightningChart API and is available as a WPF or WinForms control.
- It supports data fetching from a web server, supplying it by code, or reading it from a CSV file.
- You can perform a stock search by name or symbol.
- Supports several color themes.
- Chart types selection: mountain, line, candle-sticks, bars, DataPacking feature.
- Technical indicators supported:
- Simple Moving Average (SMA),
- Exponential Moving Average (EMA),
- Weighted Moving Average (WMA),
- Bollinger band,
- Relative Strength Index (RSI),
- Moving Average Convergence Divergence (MACD),
- Stochastic Oscillator (SO),
- Money Flow Index (MFI),
- Average True Range (ATR),
- TwoHistogramsAndLine,
- Aroon,
- Rate of Change (ROC),
- Triple Exponential Average (TRIX),
- Williams Percent Range,
- Accumulation/Distribution (A/D),
- Average Directional Index (ADX),
- Commodity Channel Index (CCI),
- Ichimoku Cloud,
- On-Balance Volume (OBV),
- Parabolic Stop-and-Reverse (PSAR),
- Percentage Price Oscillator (PPO),
- Open Interest (OI)
- Drawing tools supported:
- Trend line,
- Linear regression channel,
- Fibonacci retracement,
- Fibonacci arcs,
- Fibonacci fan,
- Freehand annotation,
- Elliot Wave,
- Head and Shoulders,
- Pitchfork,
- Triangle,
- XABCD Pattern
- DrawingTools can be set to Magnetic, causing their control points to snap to the OHLC Close value at their current location.
- Chart segments management and resizing.
- Support AlphaVantage, and MarketStack data providers.
The Trader library is built over the fast & robust LightningChart .NET API, and the Trader library source code* is provided free-of-charge, for all subscribers.
*Note: the LightningChart .NET API Source code itself is available as a paid option to subscribe.
3D Charts
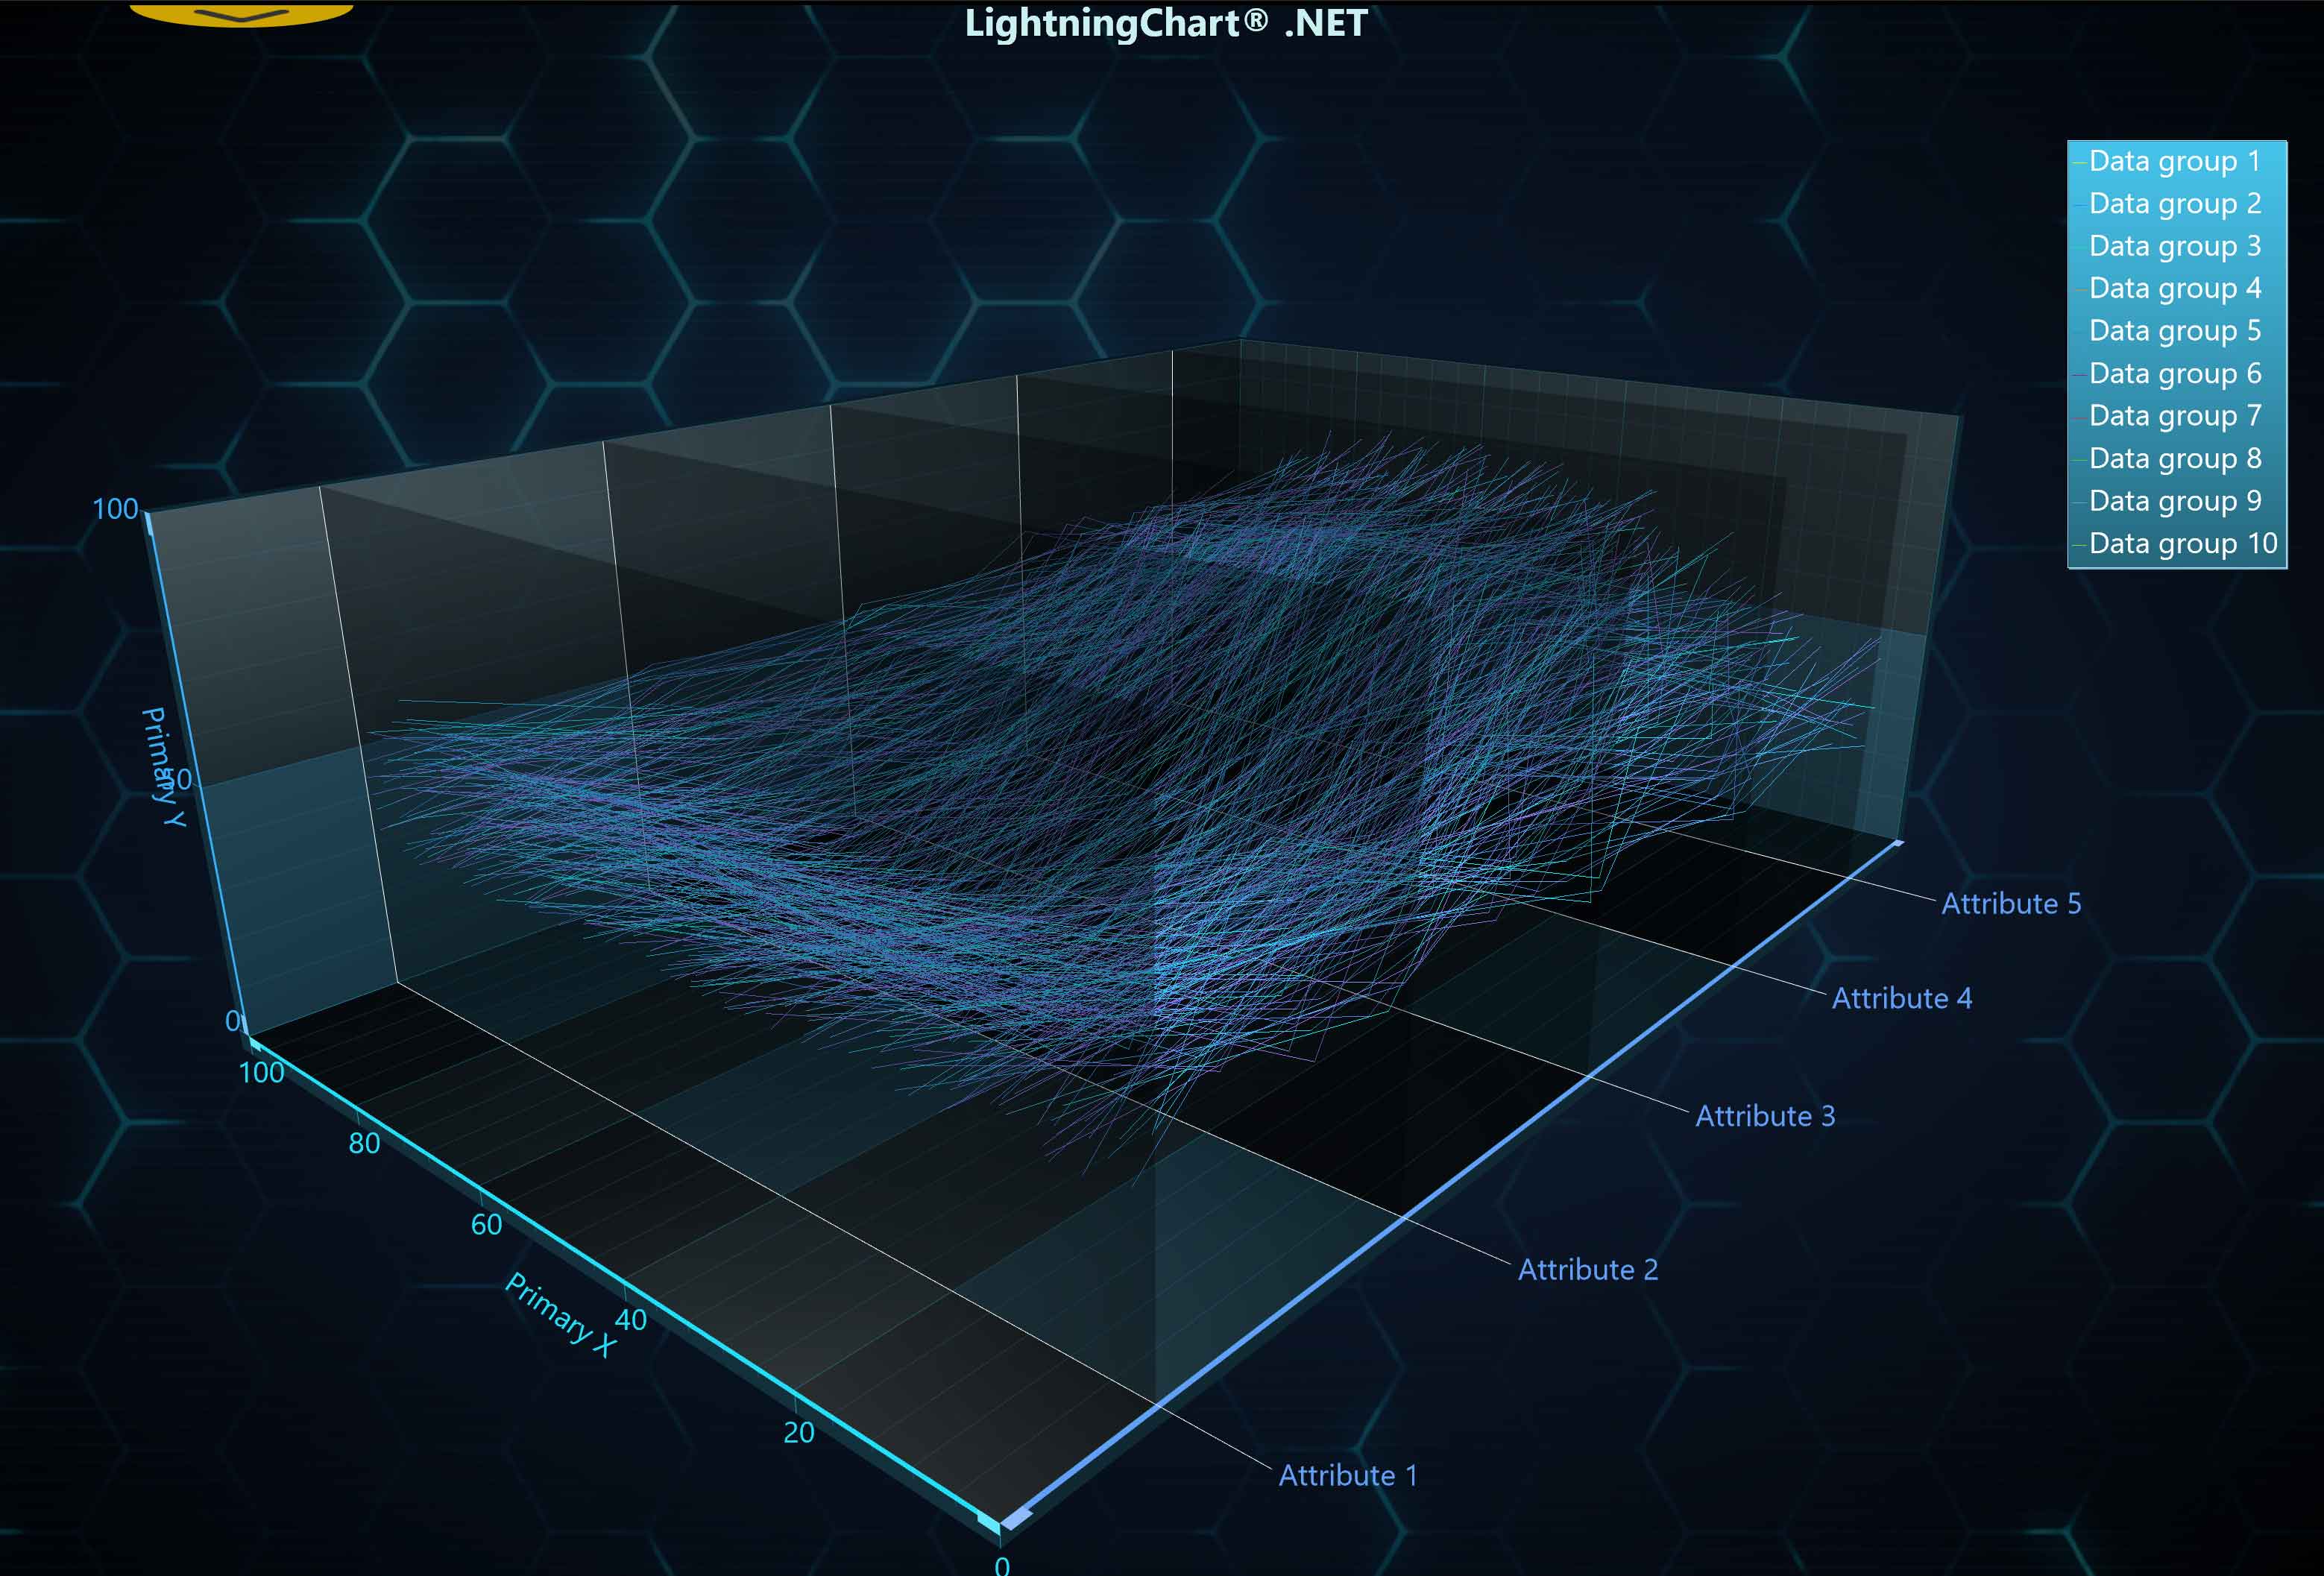
Visualize your data in an informative and interesting way in a 3D “XYZ” cartesian chart view. All 3D charts are available for WPF, Winforms, and UWP.
- The 3D world contains linear and logarithmic axes, walls, FrameBox
- Series types: surface mesh, surface grid, waterfall, polygon, rectangle planes, mesh models, line, point-line, scatter points, bar, and pie charts.
- Series could be combined with VolumeModels and CAD objects.
- 3D scene settings with multiple light sources.
- A chart can import CAD objects to a 3D Chart (using the Wavefront *.obj file format)o or construct them programmatically from vertices.
- Supports gigantic surface sizes of over 4096×4096, depending on available memory.
- Includes a ViewPie3D to visualize pie and donut charts in 3D.
- Supports dozens of properties to control rotation, zooming, and panning behavior, including a touchscreen functionality.
- Easy to show data in Spherical 3D or Cylindrical 3D with coordinate system converters.
- The chart could show 100’s millions of points cloud from LiDAR-like data.
- Point’s or surface node’s tracking functionality.
Map Charts
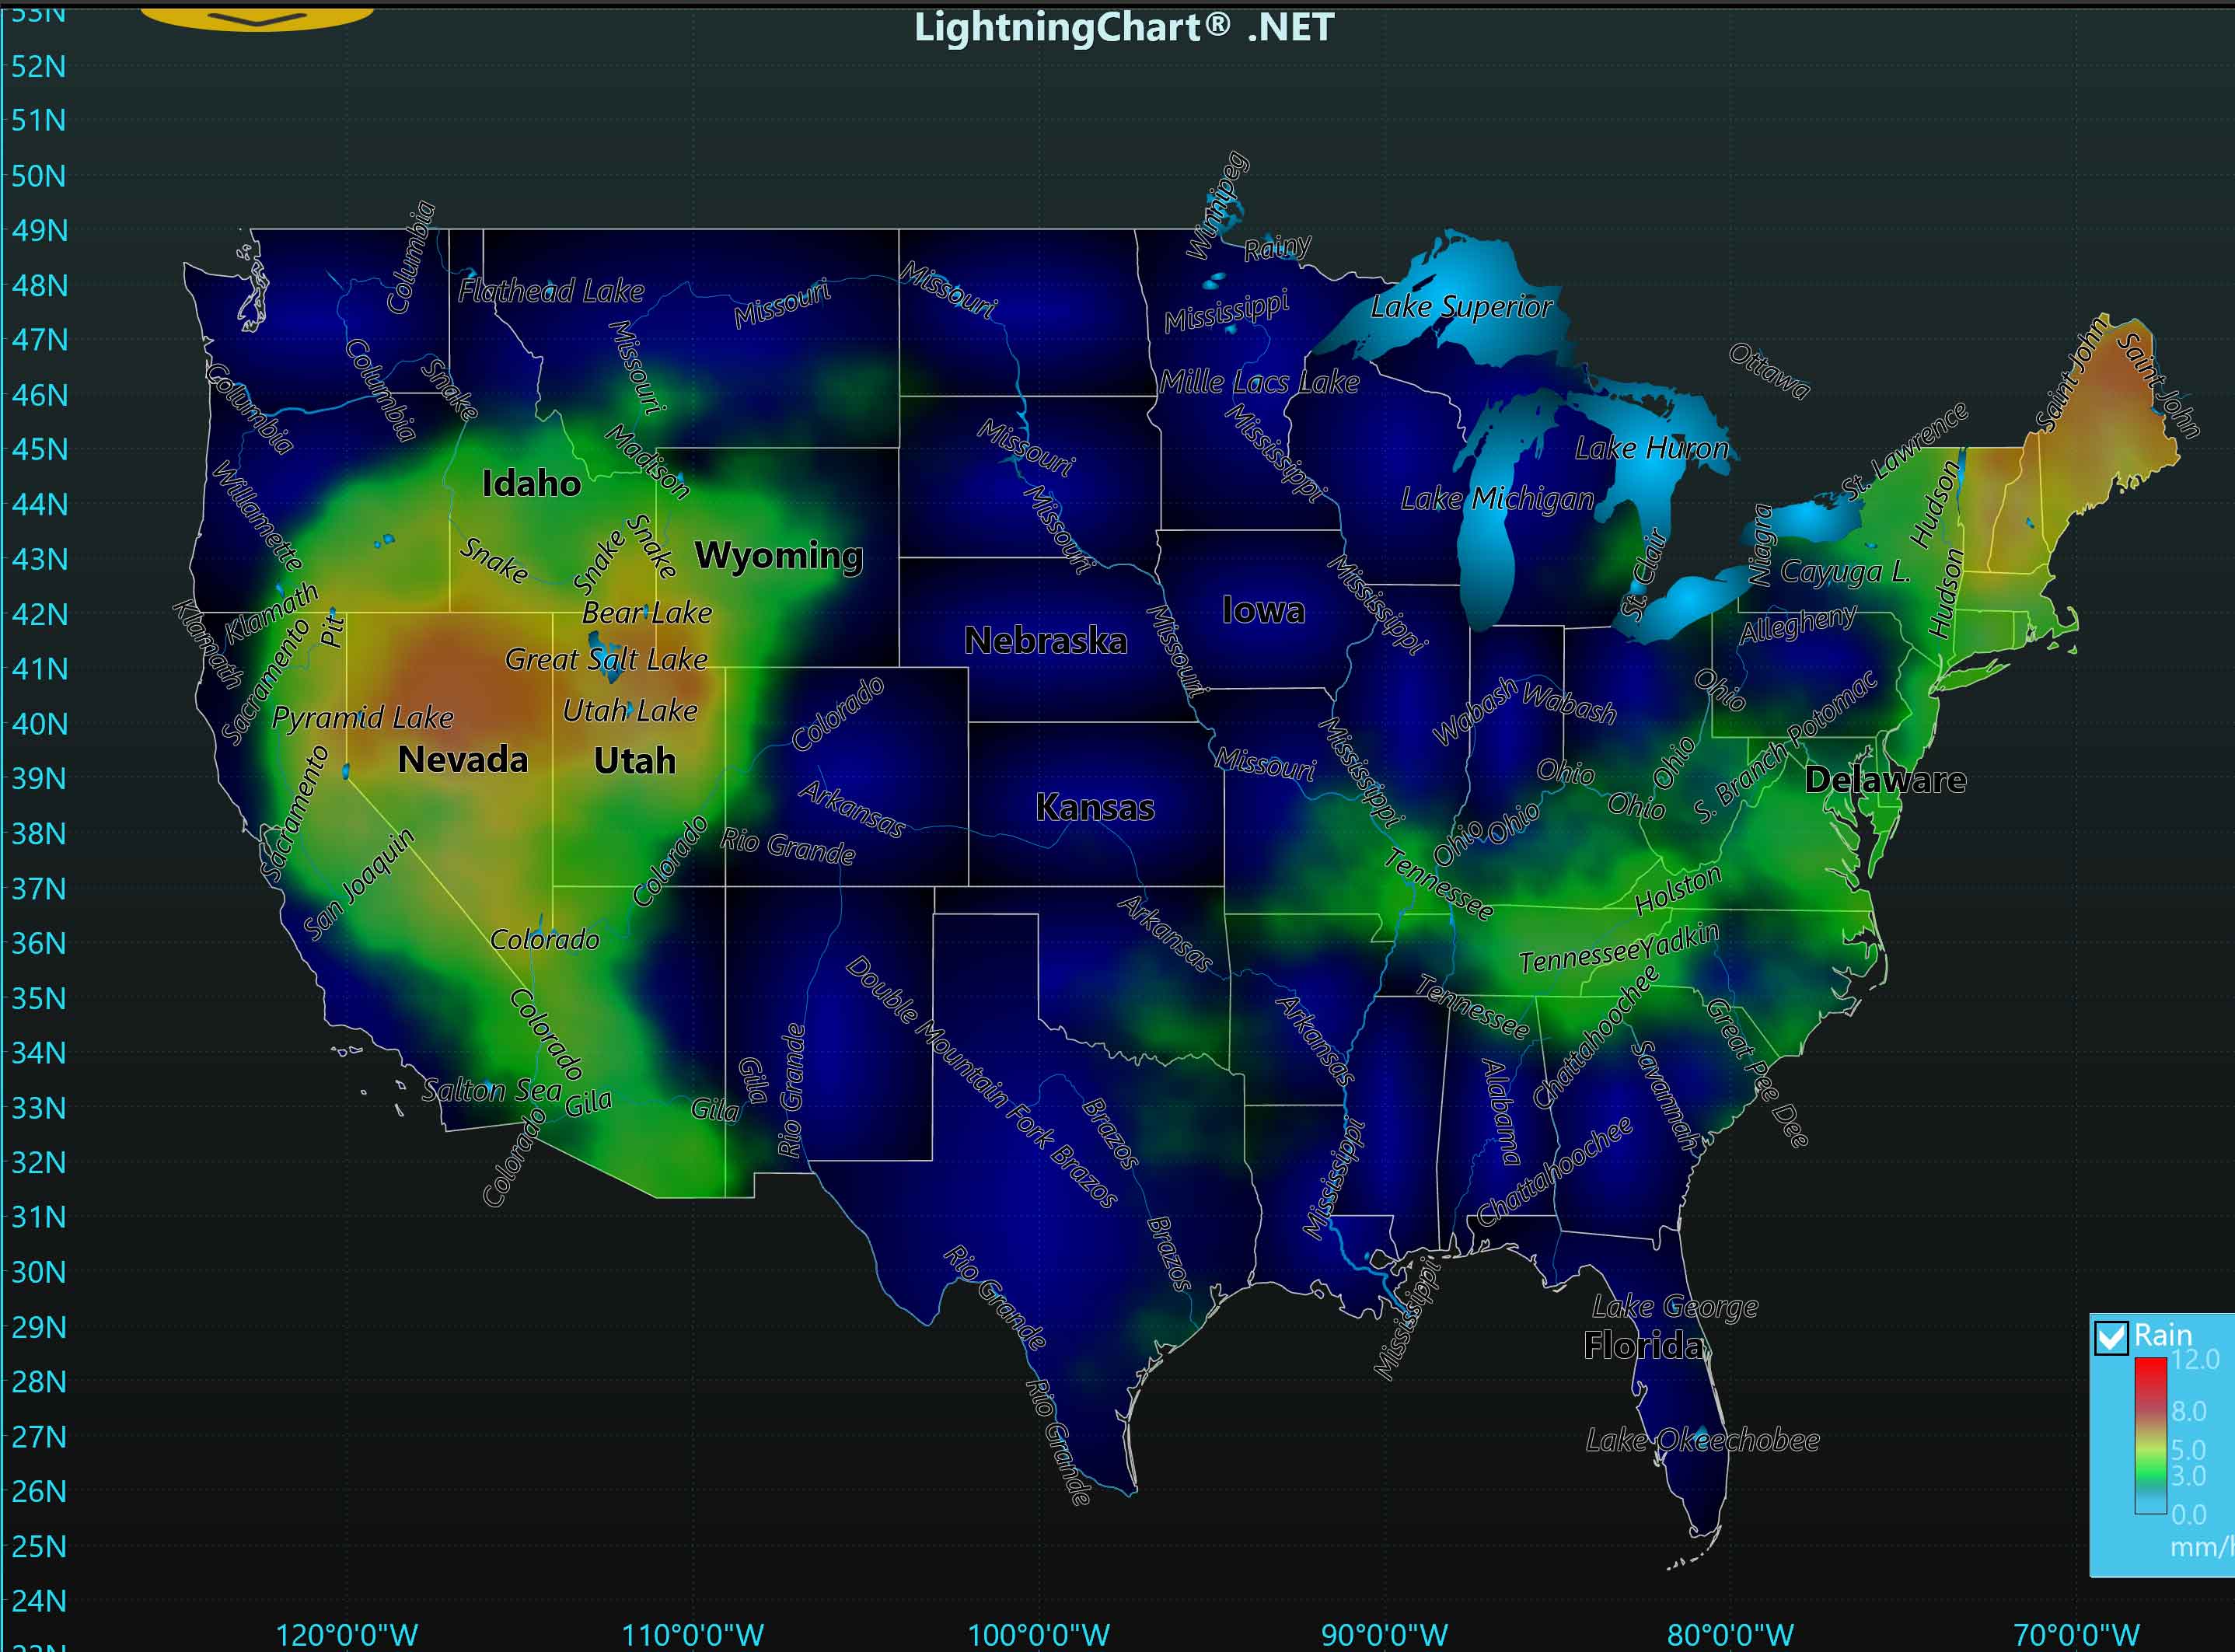
Maps are enabled using vector maps or online tile maps for visualization of geographic data. The maps are visualized in ViewXY and allow combining e.g. routes, heatmaps, or arrows in the same visualization. The maps use equirectangular projection.
- Online tile maps support street maps and satellite imagery.
- Dozens of maps: World, continents, specific areas.
- Multi-layer: land, lakes, rivers, roads, cities, etc.
- Map import from ESRI shape file data.
- Combining other XY series in the visualization.
- Axis scales presented in selectable geographic coordinates formatting
Maps are enabled using vector maps or online tile maps for visualization of geographic data.
The maps are visualized in ViewXY and allow combining e.g. routes, heatmaps, or arrows in the same visualization.
The maps use equirectangular projection.
- Online tile maps support street maps and satellite imagery.
- Dozens of maps: World, continents, specific areas.
- Multi-layer: land, lakes, rivers, roads, cities, etc.
- Map import from ESRI shape file data.
- Combining other XY series in the visualization.
- Axis scales presented in selectable geographic coordinates formatting
Polar Charts

ViewPolar allows data visualization in a polar format. The data point position is determined by angular value and amplitude. Polar view also has versatile zooming and panning features.
- Series types: line, scatter points, point-line, areas.
- Line colorization per amplitude, angle, or data point value.
- Several polar axes per the chart with unique rotation angles.
- Markers and Annotations.
- Sectors.
- Zooming, panning, and rotation with a mouse, on a touchscreen, or programmatically.
- Arc or circular-shaped gauges could be built.
Smith Charts
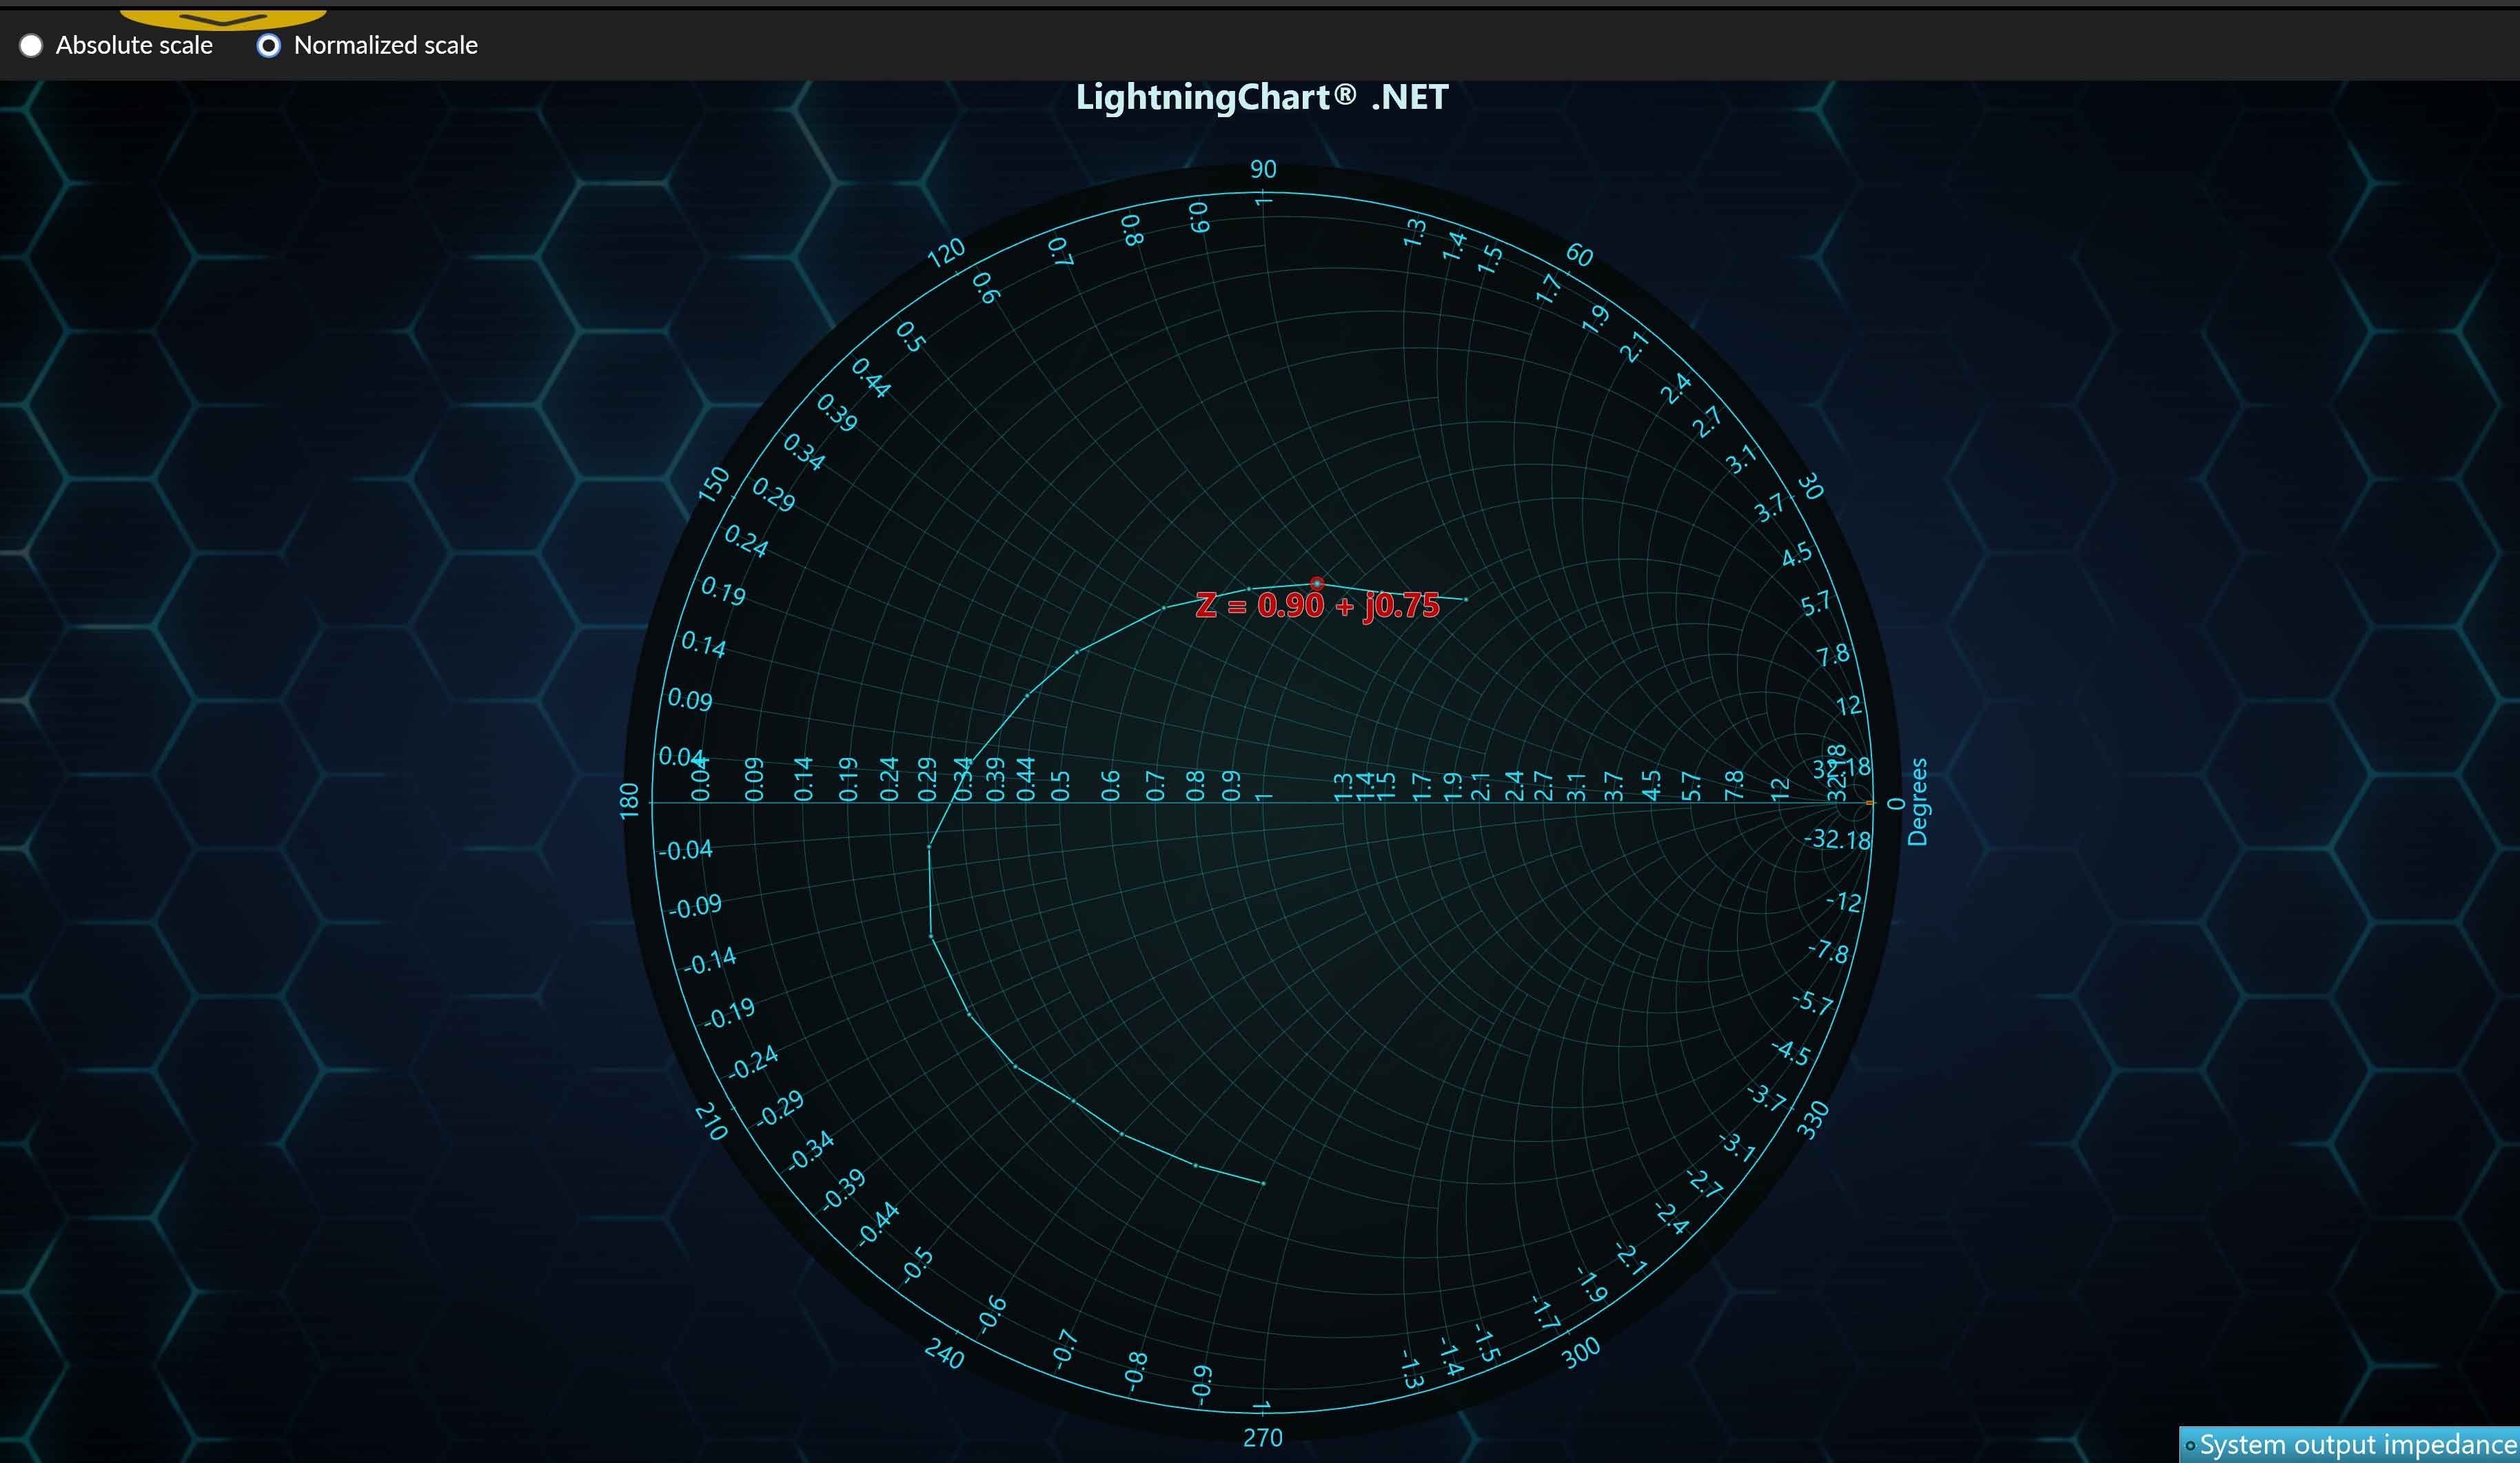
Specialized chart for radio frequency applications, like oscillator design and stability analysis. Allows simultaneous visualization of multiple parameters, like impedance, admittance, reflection coefficients scattering parameters, and so on.
- Absolute and normalized scales.
- Static distance and zoom adapting ticks and grid. Allows automatic generation of ticks and grids when zooming for a better understanding of values, without cluttering the display.
- Automatic zoom-to-fit for the whole area or data only.
- Zooming and panning via ready-made mouse operations.
- Tick values are always visible, even when zoomed in close.
- Data and grid clipping to graph area. You can show data also outside of the graph.
Volume Rendering

Volumetric information plays an essential role in medicine, e.g. for advanced cancer detection, visualization of aneurysms, and treatment planning.
It is also used for non-destructive material testing via computer tomography or ultrasound. In addition, huge three-dimensional datasets are produced by geo-seismic research, and can also be visualized by our Volume Rendering engine.
- The separate Linear Transfer function for every channel.
- Volume Thresholding in accordance with voxel brightness for every channel.
- Dynamic modification of Voxel range.
- Manual or Automatic Adaptive sampling rate of volume data.
- Three options for the Volume Rendering Ray function: accumulation, maximal intensity, and isosurface.
- Combining 3D models and series in the same visualization.
- Pixels with color from a specified range could be clipped from VolumeModel.
Signal Tools
DigitalFilter
DigitalFilter applies an FIR or IIR filter to a discrete signal to reduce/enhance certain aspects of that signal. The filter is constructed from an array of factors supplied by the user.
SignalReader
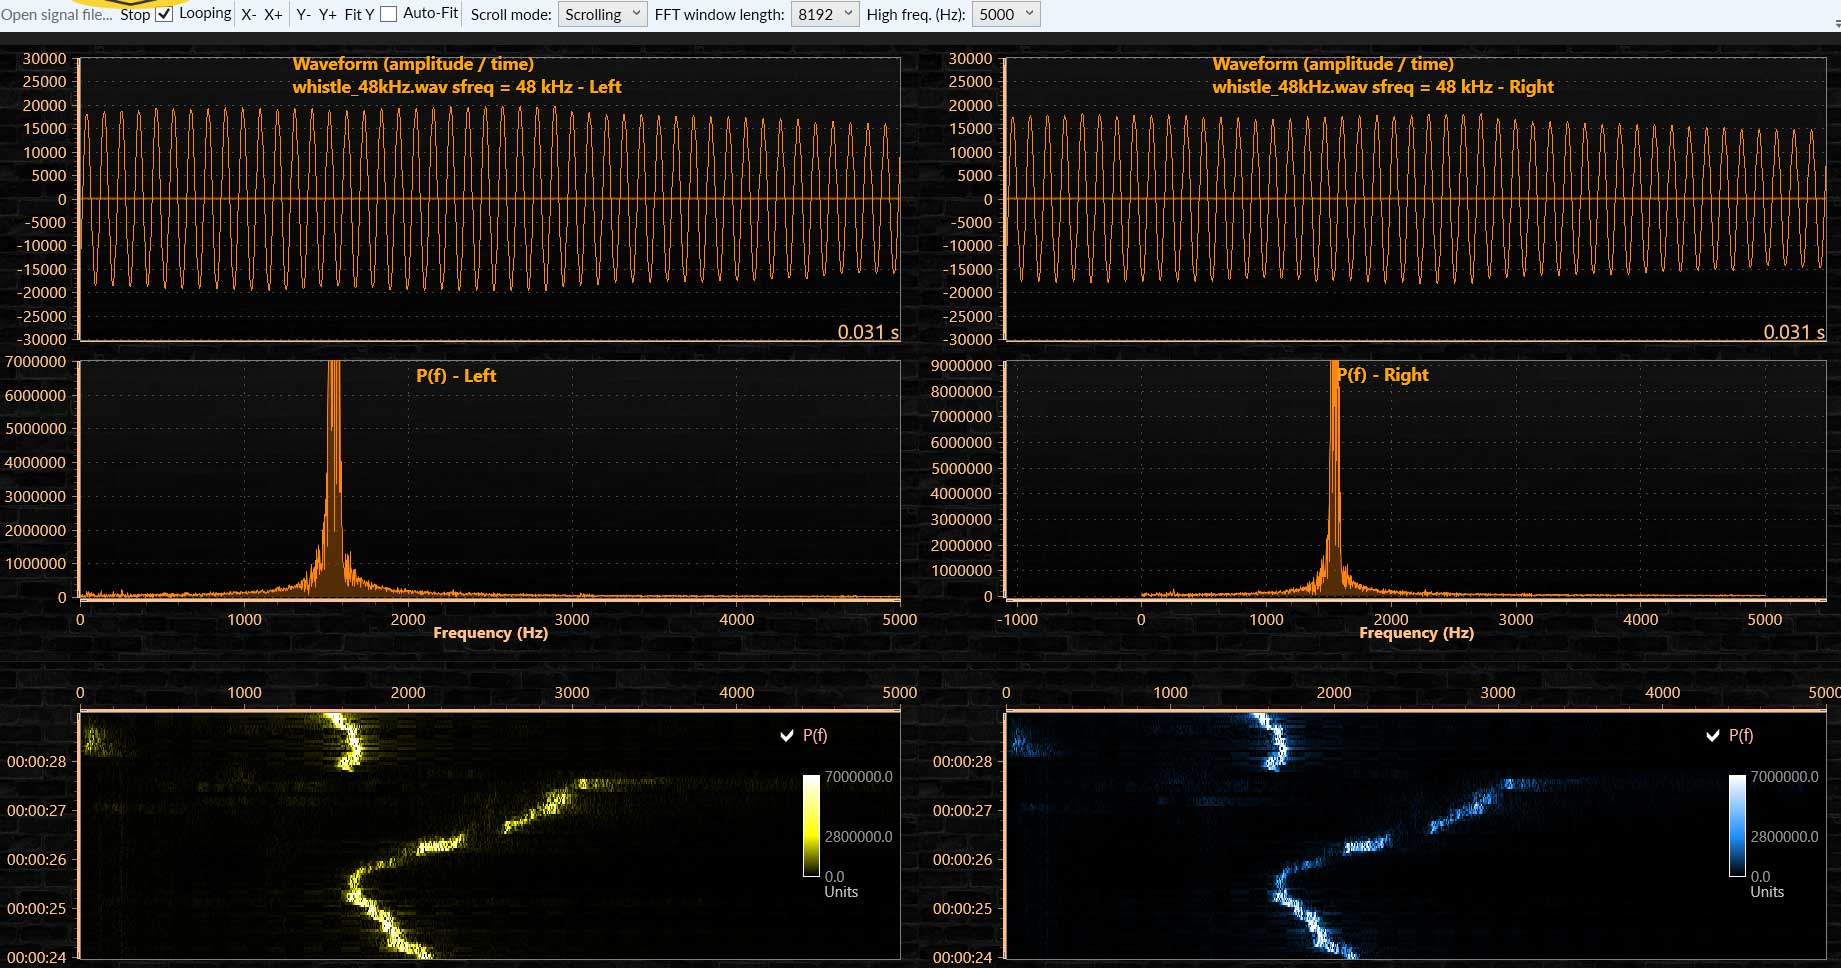
SignalReader generates real-time data stream reading signal files in different formats: WAV (PCM), sid (biosignal file), ssd (LightningChart Ultimate Demo application sample data format). The playback can be automatically restarted with the looping option.
AudioInput
Reads real-time sampled data stream from sound card line-in (using e.g. microphone) through DirectSound. The data can be forwarded to a chart, AudioOutput, or your own data target.
SignalGenerator
SignalGenerator is a multi-functional signal generator component. It allows combining different waveform types into a single, real-time output signal. The waveform components can be set with a built-in user interface or by code.
SpectrumCalculator
Converts data between the time domain and frequency domain using the Fast Fourier Transform (FFT) algorithm in Digital Signal Processing (DSP).
AudioOutput
Allows real-time data stream playback via sound card line-out (using e.g. speakers) through DirectSound. The data can be fetched from SignalGenerator, SignalReader, AudioInput, or another data source.
Chart editions
For WPF, the LightningChart charting component is available in different binding level editions, to balance between different performance and MVVM (Model – View – View-Model) bindability needs.
For the best performance in WPF and multithreading benefits, select the Non-Bindable chart.
Why LightningChart .NET?
LightningChart .NET is the fastest 2D & 3D data visualization SDK for WPF, WinForms, and UWP. It has been actively developed since 2009 and is considered the best WPF charting library. Software development kit (SDK) comes with Interactive Examples App.
This application contains over 200 interactive examples with rich functionality that is suitable for the creation of applications within the most demanding industries: science and research, engineering, economics and finance, trading, medicine, energy, space, and defense.
High – Performance
Chart control with embedded DirectX hardware (GPU) and software acceleration to develop high-performance and visually attractive applications. Data visualization SDK developed for presenting massive amounts of data with minimal flickering and delays.
Functionality
Wide range of advanced 2D, 3D, and Polar charts for the most demanding industries. Fully customizable tools (1500+ public properties and 150+ events handlers) for .NET developers with the most demanding applications.
Cost – Efficiency
Get the best value for your money. We provide the highest quality chart control and constantly strive to make it accessible for our customers. Please read about our .NET pricing here. You could further accelerate your application development by ordering Turnkey or Development Work services from LightningChart library experts.
LightningChart .NET is the fastest 2D & 3D data visualization SDK for WPF, WinForms, and UWP.
It has been actively developed since 2009.
Software development kit (SDK) comes with Interactive Examples App.
This application contains over 200 interactive examples with rich functionality that is suitable for the creation of applications within the most demanding industries: science and research, engineering, economics and finance, trading, medicine, energy, space, and defense
High – Performance
Chart control with embedded DirectX hardware (GPU) and software acceleration to develop high-performance and visually attractive applications.
Data visualization SDK developed for presenting massive amounts of data with minimal flickering and delays.
Functionality
Wide range of advanced 2D, 3D, and Polar charts for the most demanding industries.
Fully customizable tools (1500+ public properties and 150+ events handlers) for .NET developers with the most demanding applications.
Cost – Efficiency
Get the best value for your money. We provide the highest quality chart control and constantly strive to make it accessible for our customers. Please read about our .NET pricing here.
You could further accelerate your application development by ordering Turnkey or Development Work services from LightningChart library experts.
The Highest Performance On the Market
LightningChart is an entirely GPU-accelerated and performance-optimized charting component that can display record-breaking amounts of data points in real-time. What does this mean for you?
- Real-time monitoring without flickering or delays.
- High-resolution datasets.
- Smooth Interactivity.
- Efficient use of machine resources.
- Ability to render data with the old machine hardware, maintaining all advantages mentioned above.
Countless hours of product development and hard work of the LightningChart .NET development team have resulted in LightningChart .NET becoming an absolute charting library with unmatched performance results that would impress even the most demanding developers in the industry.
We’ve demonstrated in-depth why LightningChart .NET is the number 1 provider of WPF charts, Winforms charts, and UWP charts. We constantly strive for the highest performance indicators in the industry.
For the most demanding developers
LightningChart .NET includes a wide range of advanced 2D, 3D, Polar, Smith, 3D pies/donuts, Geographic maps & G.I.S. charts, and Volume Rendering features for science, engineering, medicine, aerospace, trading, energy, and other fields.
With outstanding performance, the LightningChart .NET charting library offers fully customizable tools and flexibility to the .NET developers (1500+ public properties and 150+ events handlers) and has positioned as the best WPF charting library.
Our technical support team is known for its ability to handle every challenge from our clients so that you will receive unlimited dedicated support during your active subscription.
General Information
- Allows full mouse interaction, touchscreen support, and custom mouse interactivity extensions.
- Supports Cursors and Annotations, data colorizing with color palette, and full customizability of components.
- Data breaking by NaN or other specified breaking values, in selected series types.
- Features Numeric, Time, DateTime, Logarithmic, Geographic Coordinate System (GCS), and Custom axis scales.
- Provides 5-star professional technical support and hundreds of chart examples.
- Fully compatible with Visual Studio 2022 & .NET 6
Rendering Technology
- DirectX 11 & DirectX 9 support.
- Automatic software rendering with WARP in systems without graphics hardware and for virtual machines.
- Selectable font quality.
- HiDPI scaling support.
- Can be run in both 32-bit and 64-bit modes.
- Controllable anti-aliasing options
Conclusion
LightningChart .NET stands out as the best WPF charting library due to its exceptional performance, advanced features, and intuitive API.
With its GPU-accelerated rendering, LightningChart .NET can handle vast amounts of data and create smooth and responsive visualizations.
Its comprehensive set of chart types and customization options allows developers to create beautiful and informative charts tailored to their specific needs.
Additionally, the library’s user-friendly API makes it easy to integrate into any project and simplifies the charting process for developers.
Overall, LightningChart .NET is a reliable and powerful charting library that delivers exceptional performance and functionality, making it an excellent choice for anyone looking to create high-quality charts in their WPF application.

