


Best ScottPlot Alternative in 2026: GPU Rendering, 3D Charts, Cross-Language Support
Article

Jarkko Tirkkonen
Senior Developer

ScottPlot is genuinely excellent for what it is: a free, MIT-licensed, actively developed .NET plotting library with an honest focus on interactive large-dataset display. The GDI+ rasterized renderer — which draws the entire chart as a pixel bitmap rather than managing per-point rendering primitives — handles data volumes meaningfully better than SVG-based commercial alternatives like Telerik and DevExpress. WinForms, WPF, Blazor, Avalonia, and Console targets are all supported. The API is clean, the GitHub community is active, and the price is right for teams that can use an MIT-licensed library in production.The scenarios where ScottPlot becomes the wrong choice are specific. There are no 3D chart types of any kind no surface charts, no 3D scatter, no 3D heatmaps making it a non-starter for applications that need genuine three-dimensional data exploration. The GDI+ renderer is CPU-bound: at data volumes in the tens of millions, or real-time streaming at high update rates sustained over hours, the renderer begins to slow in ways that GPU rendering eliminates categorically. There is no commercial support tier or SLA the library is community-driven, which is fine for most use cases but creates procurement challenges for enterprise applications with support requirements. And ScottPlot is .NET-only: there is no equivalent JavaScript or Python library, which matters for teams that need visualization consistency across their full stack.
1. When ScottPlot Is Not Enough
No 3D chart support
ScottPlot’s chart catalog covers standard 2D scientific chart types well: line plots, scatter plots, bar charts, pie charts, heatmaps (2D), financial OHLC, error bars, arrow fields, and statistical boxes. What it doesn’t include: surface charts (2.5D function visualization), 3D scatter plots for multivariate data exploration, 3D heatmaps for spectral analysis, or any visualization requiring genuine three-dimensional space. For engineering simulation output, scientific volume data, terrain analysis, or financial risk surfaces, ScottPlot is categorically out of scope regardless of its other qualities.
GDI+ CPU rendering ceiling for extreme data volumes
ScottPlot’s rasterized renderer is faster than SVG alternatives for the same data volumes because the entire chart is drawn as a bitmap rather than managing DOM elements. This makes ScottPlot genuinely better than Telerik RadChartView or DevExpress charts at large datasets. But GDI+ is still CPU-sequential — every pixel of every chart frame is computed by the CPU on the main thread. At tens of millions of data points, render times grow to seconds. At sustained high-frequency real-time streaming (10,000+ points per second over hours), the CPU rendering work accumulates frame by frame, leading to the same progressive frame rate degradation that affects all CPU-bound renderers.
No commercial support or SLA
ScottPlot is community-supported. There is no paid support tier, no SLA, no guaranteed response time, and no named entity legally responsible for ongoing maintenance. For enterprise applications deployed to production environments with uptime requirements and support contracts, this creates procurement challenges. In 2024 the project briefly paused anonymous pull request contributions while the lead maintainer addressed a health situation a transparent and understandable decision, but one that illustrated the risk inherent in community-only projects for production-critical infrastructure.
No JavaScript or Python equivalent
ScottPlot is .NET only. Teams maintaining JavaScript web applications, Python data science workflows, or both alongside .NET desktop tools have no ScottPlot equivalent for the other layers. Visualization consistency across the full stack requires a separate library for each environment with no shared API, chart type catalog, or rendering characteristics.
2. What ScottPlot Does Genuinely Well
Before covering alternatives, intellectual honesty requires acknowledging what ScottPlot gets right. This section matters because the right alternative depends on which of ScottPlot’s actual limitations is the actual trigger.
- Free, MIT-licensed, no restrictions: ScottPlot costs nothing and imposes no commercial restrictions. For teams or organizations where this is the fundamental requirement, it remains the best free .NET chart library available.
- Better large-data performance than SVG-based commercial alternatives: ScottPlot handles data volumes that Telerik and DevExpress chart controls cannot. The GDI+ rasterized model is genuinely faster for data-intensive 2D charts than SVG/Direct2D rendering.
- Scientific and engineering chart types: Error bars, arrow fields, statistical boxes, financial OHLC, 2D heatmaps types that commercial chart libraries sometimes omit are covered in ScottPlot.
- Broad .NET platform coverage: WinForms, WPF, Blazor, Avalonia, and Console targets. The same library code works across the .NET ecosystem.
- Active community: GitHub issues are addressed, documentation is maintained, and NuGet packages are current.
3. Comparison Table
| Library | Platform | GPU rendering | 3D charts | Commercial support | Cross-language | License |
|---|---|---|---|---|---|---|
| LightningChart .NET | WinForms/WPF/UWP | GPU | Full 3D | Commercial SLA | JS + Python | Commercial |
| ScottPlot | .NET (all) | GDI+ | No | Community only | .NET only | MIT (free) |
| OxyPlot | .NET + Xamarin/MAUI | SW renderer | No | Community only | .NET only | MIT (free) |
| LiveCharts2 | .NET + MAUI | SW | No | Partial commercial | .NET only | MIT community; commercial |
| Telerik RadChartView | WPF/WinForms | Direct2D (limited) | No | Commercial | No | Suite license |
| DevExpress Charts | .NET + Web | SVG/Canvas | No | Commercial | No | Suite license |
| LightningChart JS | Web/Blazor | GPU | Full 3D | Commercial | .NET + Python | Free non-commercial; commercial |
4. The Alternatives In Depth
1 LightningChart .NET (Recommended)
Platform: WinForms, WPF, UWP | Rendering: GPU/WebGL | 3D: Full native suite | Support: Commercial SLA
LightningChart .NET is the right alternative when ScottPlot’s GDI+ rendering ceiling has been reached, 3D visualization is required, or commercial support is a procurement requirement. GPU rendering handles tens of millions of data points in sub-100ms load times with 60 FPS real-time streaming sustained indefinitely data lives in GPU vertex buffers rather than CPU-managed memory, so there’s no rendering calculation growing over time.
The 3D suite is native and GPU-accelerated: surface charts for function and terrain visualization, 3D scatter for multivariate data exploration, 3D heatmaps for spectral and frequency analysis, 3D spectrograms. These work in WinForms, WPF, and UWP with native controls. The cross-language family provides what ScottPlot cannot: LightningChart JS for JavaScript/web applications and LightningChart Python for Jupyter/PyQt/PySide the same GPU rendering engine and chart type catalog across all three environments.
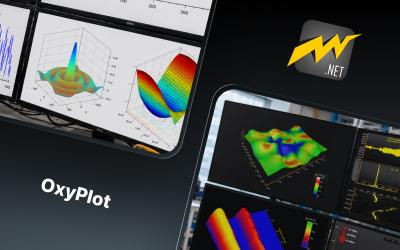
2 OxyPlot
Platform: .NET WPF, WinForms, Xamarin, Avalonia, MAUI | License: MIT always free | Rendering: Software renderer
OxyPlot is ScottPlot’s closest free alternative with broader cross-platform .NET coverage. Where ScottPlot targets WinForms, WPF, Blazor, Avalonia, and Console, OxyPlot adds Xamarin and MAUI relevant for applications that also need iOS or Android mobile targets in the same codebase. The API style is similar to ScottPlot, the chart types overlap significantly for scientific and engineering use cases, and performance characteristics are comparable at moderate data volumes. Both are community-maintained without commercial support.
OxyPlot’s cross-platform coverage is genuinely broader, but ScottPlot typically performs better at large data volumes because of the GDI+ rasterized renderer. OxyPlot’s software renderer calculates each chart element in a platform-abstracted way that runs on any target but isn’t as optimized as ScottPlot’s Windows-native GDI+ implementation.
3 LiveCharts2
Platform: .NET WPF, WinForms, Blazor, Avalonia, MAUI | License: MIT community; paid for some features | Notable: Modern API, MVVM-friendly
LiveCharts2 is the most modern-feeling .NET charting library in this comparison from an API design perspective. MVVM-friendly data binding, smooth animations, a clean fluent API, and full MAUI cross-platform support make it appealing for teams building greenfield .NET 6+ applications. The visual quality of default charts is higher than both ScottPlot and OxyPlot. Commercial tiers exist for teams that need features or support beyond the MIT community release.
Performance is in a similar tier to OxyPlot and below ScottPlot for large static datasets. LiveCharts2 is optimized for aesthetic chart rendering rather than extreme data volume throughput. For applications where chart appearance and MVVM developer experience are the priority and data volumes are moderate, it’s the strongest choice in the free .NET tier.
4 Telerik RadChartView
Platform: WPF, WinForms | License: Telerik suite license | Notable: Full ecosystem integration
If the reason for evaluating ScottPlot alternatives is needing ecosystem integration a charting component that shares themes, data binding models, and licensing with your existing WPF/WinForms grid and form controls Telerik provides that integration. The suite license covers grid, scheduler, editors, and charts in one package. However, Telerik’s own forums document performance ceilings that are actually lower than ScottPlot’s for large data volumes: 90,000 static points is confirmed “too much” by Telerik engineers, while ScottPlot handles that comfortably. Consider Telerik only when ecosystem integration is the overriding requirement and performance has not been a problem.
5 DevExpress Charts (.NET)
Platform: WPF, WinForms, ASP.NET, Blazor | License: DevExpress suite license
Another full UI suite with bundled charting, positioned similarly to Telerik. DevExpress’s own support forums document JavaScript stopping at 70,000+ data points and performance issues at 50,000. Like Telerik, the commercial suite integration is the appeal rather than chart performance and for data-intensive applications, ScottPlot outperforms DevExpress’s chart controls. The case for DevExpress over ScottPlot is entirely about non-chart UI components, not chart performance.
6 LightningChart Python (for Python-layer parity)
Platform: Python — Jupyter, PyQt, PySide | License: Free non-commercial; commercial
If the reason for looking beyond ScottPlot is needing visualization in the Python data science layer alongside the .NET desktop application, LightningChart Python is the direct replacement for the Python side. GPU-accelerated rendering in Jupyter notebooks and PyQt/PySide applications, the same 100+ chart types as LightningChart .NET, accepting numpy arrays directly. No Python equivalent to ScottPlot exists this is the gap ScottPlot’s .NET-only nature leaves open.
7 LightningChart JS (for web/Blazor parity)
Platform: Web / JavaScript / Blazor | License: Free non-commercial; commercial
If the gap is a web dashboard or Blazor application that needs to match the chart performance and types available in the .NET desktop application, LightningChart JS provides GPU-accelerated WebGL charting for web with the same rendering engine and chart catalog as LightningChart .NET. No ScottPlot equivalent exists for JavaScript or Blazor WebAssembly this is the cross-language gap that only LightningChart’s family addresses.
5. Performance Benchmarks
.NET desktop chart performance WPF/WinForms
| Library | Rendering | 100K pts load | 1M pts load | 10M pts load | Real-time 10K pts/sec |
|---|---|---|---|---|---|
| LightningChart .NET | GPU | Sub-50ms | Sub-200ms | Sub-500ms | 60 FPS sustained |
| ScottPlot | GDI+ rasterized | ~100–300ms | ~1–3s | ~10–20s+ | ~30 FPS, degrades |
| OxyPlot | Software renderer | ~200–500ms | ~3–5s | Impractical | Significant lag |
| LiveCharts2 | Software | ~150–400ms | ~2–5s | Impractical | Moderate at low rate |
| Telerik RadChartView | Direct2D (partial) | Slow — forum documented | Confirmed failure | No | UI freeze reported |
Capability comparison
| Capability | ScottPlot | LightningChart .NET | OxyPlot | LiveCharts2 |
|---|---|---|---|---|
| GPU rendering | No | Yes | No | No |
| 3D surface charts | No | Yes | No | No |
| 3D scatter/heatmap | No | Yes | No | No |
| Commercial support SLA | No | Yes | No | Partial |
| JavaScript equivalent | No | LC JS | No | No |
| Python equivalent | No | LC Python | No | No |
| MAUI support | Partial | No (check current) | Yes | Yes |
| License cost | Free (MIT) | Commercial | Free (MIT) | Free / commercial |
6. The Cross-Language Dimension
One of ScottPlot’s fundamental limitations is that it exists only in .NET. For teams whose applications span multiple environments a WPF dashboard, a Python data science notebook, a React web frontend ScottPlot covers one layer and leaves the others without a high-performance equivalent.
LightningChart as a cross-language visualization stack
- .NET Desktop (WPF, WinForms, UWP): LightningChart .NET GPU rendering, 100+ chart types, full 3D suite
- Python (Jupyter, PyQt, PySide): LightningChart Python same GPU engine, accepts numpy arrays natively
- Web (JavaScript, React, Vue, Angular, Blazor): LightningChart JS WebGL rendering, same chart catalog, official framework wrappers
All three share the same rendering engine, chart type catalog, and API concepts. Developers move between environments with a consistent mental model. ScottPlot covers only the first of these three.
7. Migration Guide: ScottPlot to LightningChart .NET
ScottPlot (WinForms):
// ScottPlot — simple WinForms integrationvar plt = new ScottPlot.Plot(600, 400);double[] xs = DataGen.Consecutive(dataPoints.Length);double[] ys = dataPoints;plt.AddSignal(ys, sampleRate: 10_000);plt.Title("Sensor Data");plt.XLabel("Time (s)");plt.YLabel("Value");formsPlot1.Reset(plt);formsPlot1.Refresh();
LightningChart .NET equivalent (WinForms) — GPU rendering, 3D capable:
// Add LightningChartUltimate control to form in designer, then:using Arction.WinForms.Charting;using Arction.WinForms.Charting.SeriesXY;lightningChart1.BeginUpdate();lightningChart1.Title.Text = "Sensor Data";var series = new SampleDataSeries(lightningChart1.ViewXY,lightningChart1.ViewXY.XAxes[0],lightningChart1.ViewXY.YAxes[0]);series.Title.Text = "Sensor";series.SampleRate = 10_000; // samples per secondseries.FirstSampleTimeStamp = 0;series.AddSamples(dataPoints, false); // float[] direct from bufferlightningChart1.ViewXY.SampleDataSeries.Add(series);lightningChart1.EndUpdate(); // Handles 10M+ points — no GDI+ ceiling
Key differences:
- Plot object model: ScottPlot wraps a
Plotobject in aFormsPlotcontrol. LightningChart .NET exposes the chart control directly with aViewXYmodel add it to the form in the designer, then configure in code. - Data input: ScottPlot uses
double[]arrays. LightningChart .NET has aSampleDataSeriesacceptingfloat[]at a defined sample rate the most efficient path for uniform time series. For non-uniform data,PointLineSeriesacceptsSeriesPoint[]with explicit x/y values. - Refresh model: ScottPlot requires explicit
Refresh()calls. LightningChart .NET usesBeginUpdate()/EndUpdate()to batch changes into a single GPU upload. - 3D charts: ScottPlot has no equivalent for LightningChart .NET’s surface, 3D scatter, and 3D heatmap series types these are new capabilities, not replacements for existing ScottPlot code.
8. Decision Tree
- Do you need 3D chart types surface charts, 3D scatter, 3D heatmaps?
Yes: LightningChart .NET. ScottPlot has no 3D capability.
No: Continue. - Have you hit ScottPlot’s GDI+ ceiling multi-second load times at millions of points, or real-time streaming degrading over long sessions?
Yes: LightningChart .NET GPU rendering eliminates this ceiling.
No: Continue. - Is a commercial support SLA a procurement requirement?
Yes: LightningChart .NET or Telerik (if suite integration is the priority). ScottPlot and OxyPlot are community-only.
No: Continue. - Does your team also need Python visualization or a JavaScript web equivalent?
Yes: LightningChart family — LightningChart Python + LightningChart JS. ScottPlot has no equivalent.
No: Continue. - Is zero cost the absolute constraint and data volumes stay within GDI+ range?
ScottPlot remains the right choice it handles large-data .NET 2D charting better than any other free option. OxyPlot if MAUI coverage is needed. LiveCharts2 if modern API and animations are the priority.
9. FAQ
What is the best ScottPlot alternative for .NET?
LightningChart .NET when GPU performance, 3D charts, or commercial support are required. OxyPlot when Xamarin/MAUI cross-platform coverage is needed at zero cost. LiveCharts2 when a modern MVVM API and animations matter at moderate data volumes.
Does ScottPlot support 3D charts?
No. ScottPlot has no 3D chart types. LightningChart .NET provides a full GPU-native 3D suite including surface grids, 3D scatter plots, 3D heatmaps, and 3D spectrograms for WinForms and WPF.
Is ScottPlot still actively maintained?
ScottPlot has an active GitHub community and continues to receive updates. The project briefly paused anonymous contributions in 2024 due to the lead maintainer’s health situation a transparent decision that was handled openly. For applications requiring a guaranteed commercial support SLA, this community-only model creates procurement risk that LightningChart .NET resolves with a commercial support tier.
How does ScottPlot compare to LightningChart .NET for large datasets?
ScottPlot’s GDI+ rasterized renderer handles data volumes better than SVG-based commercial alternatives. LightningChart .NET’s GPU rendering provides a further categorical improvement: sub-100ms loads at millions of data points versus seconds for ScottPlot, and sustained 60 FPS real-time streaming that ScottPlot’s CPU renderer cannot maintain at high data rates over long sessions.
Is there a ScottPlot equivalent for Python or JavaScript?
ScottPlot is .NET-only with no equivalent for other languages. LightningChart Python provides GPU-accelerated Python charting in Jupyter/PyQt/PySide. LightningChart JS provides the web equivalent. Both share the same rendering engine and chart catalog as LightningChart .NET.
Further reading:
Continue learning with LightningChart
Best ApexCharts Alternatives in 2026: Scale Beyond SVG, Add Real 3D
ApexCharts earned its position through a set of genuine strengths executed consistently well: MIT license, the best default visual aesthetics among free JavaScript chart libraries, official and actively maintained React, Vue, and Angular component wrappers, clean...
Best amCharts Alternatives in 2026: No Watermark, Faster, Real 3D
amCharts 5 wins on visual aesthetics. The default chart transitions are among the smoothest in the JavaScript charting space, the animation quality is a genuine differentiator, and the chart type range Gantt charts, flowcharts, geographic maps, financial OHLC, Sankey...
Best OxyPlot Alternative in 2026: GPU Rendering, 3D Charts, Commercial Support
OxyPlot has been a reliable reference point in the .NET scientific and engineering charting space for over a decade. MIT-licensed, platform-neutral in its rendering model (which is how it achieves coverage across WPF, WinForms, Xamarin, Avalonia, and MAUI from a...


If you have any questions, feel free to contact us!
©LightningChart Ltd 2026. All rights reserved.