


The most complete Python Library for visualizing
financial data


Python financial graphing library
Meet the best technology for visualizing financial and trading data with LightningChart Python Trader
WebGL rendering
WebGL leverages the GPU for smoother and high-performance rendering, outperforming charting technologies based on HTML5 Canvas or SVG.

GPU acceleration
GPU acceleration is leveraged to handle large datasets and real-time updates, ensuring smooth performance even with extensive financial. datasets.

High-end visuals
Built-in powerful, interactive, and customizable charts for visualizing large and complex financial and trading datasets.
Scalability
Comprehensive and well-structured API documentation, ensuring a an easy user experience to get started with visualizing financial data in no time.
Built-in functionalities with finance at the core
Perform advanced financial data visualization with ready-to-use tools
Get LightningChart Python Trader
Get the charting package you need - customize your subscription
| License type | Commercial | |
| Technical indicators |
100+
Read the full list of 100+ technical indicators
|
|
| Drawing Tools |
30+
Read the full list of 30+ drawing tools
|
|
| Charts | ||
| Candlestick |
|
|
| Bar |
|
|
| Line |
|
|
| Mountain |
|
|
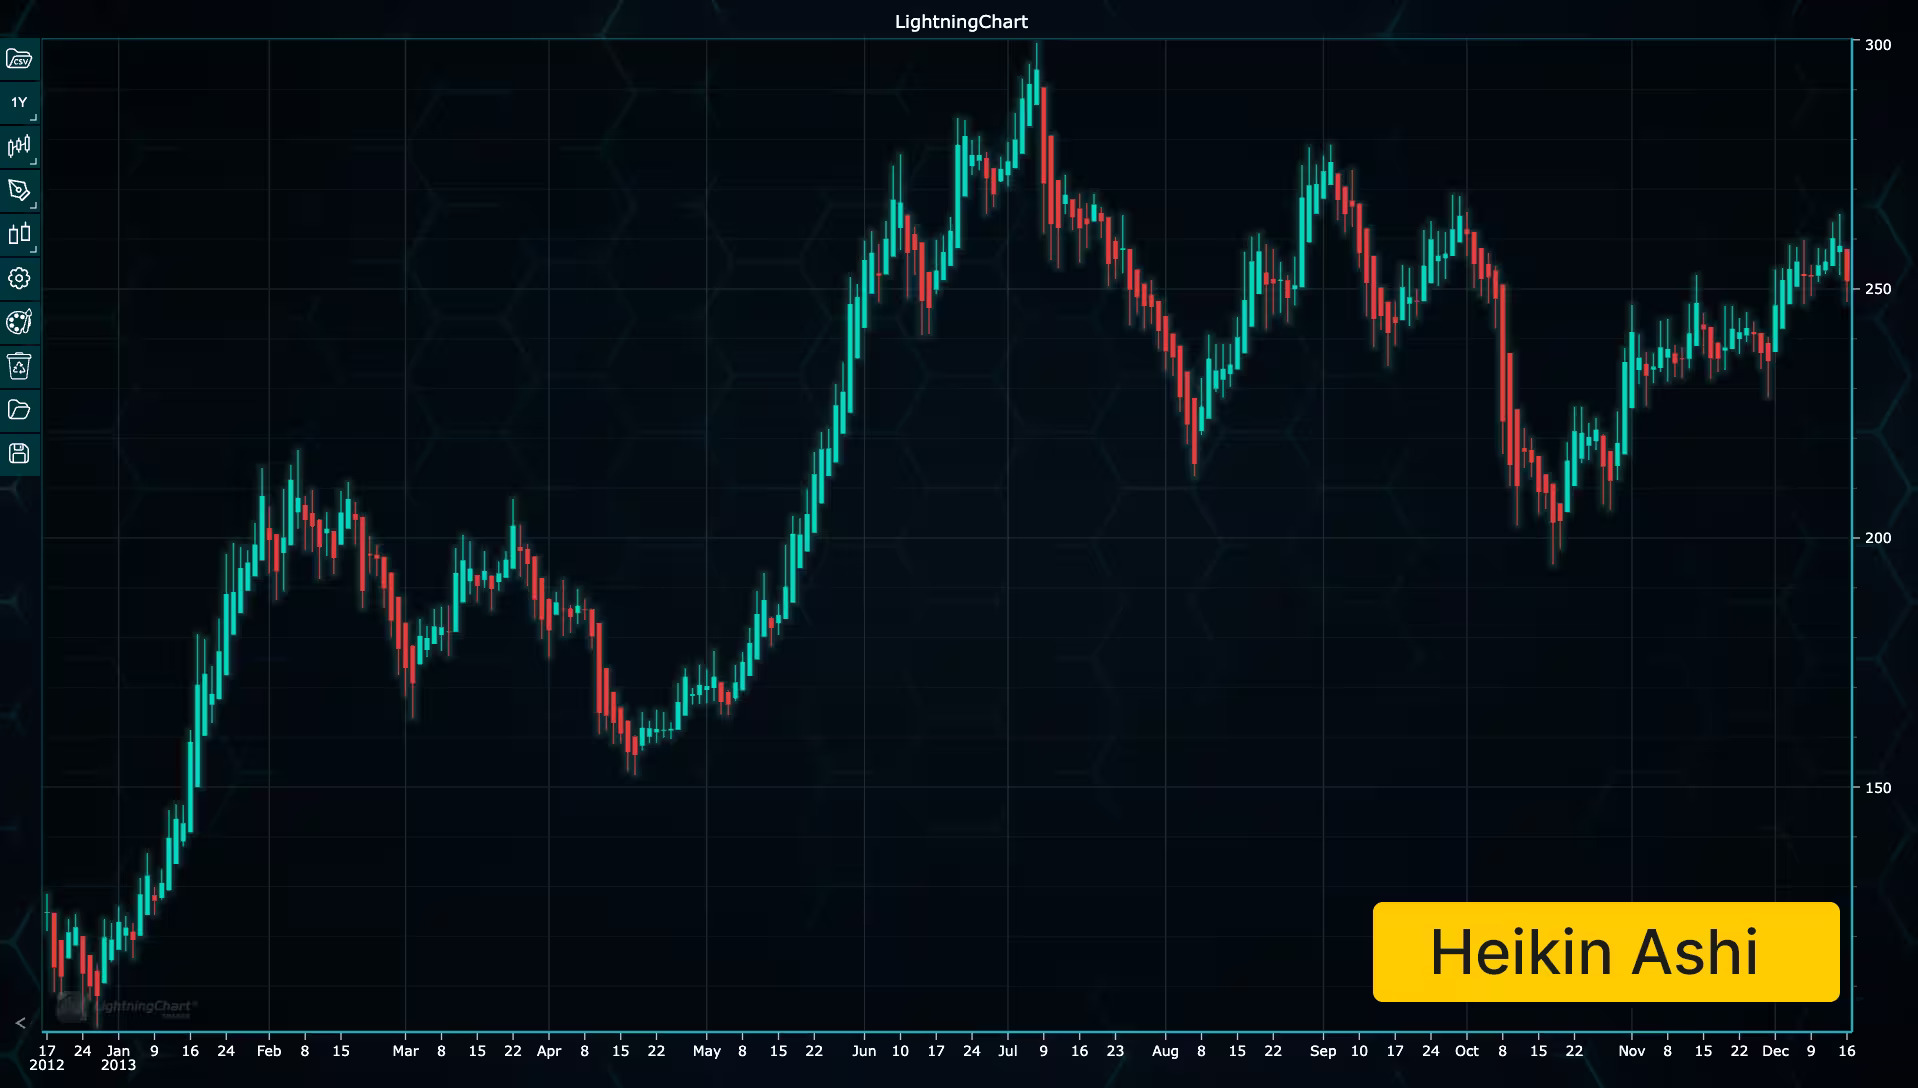
| Heikin Ashi |
|
|
| Renko |
|
|
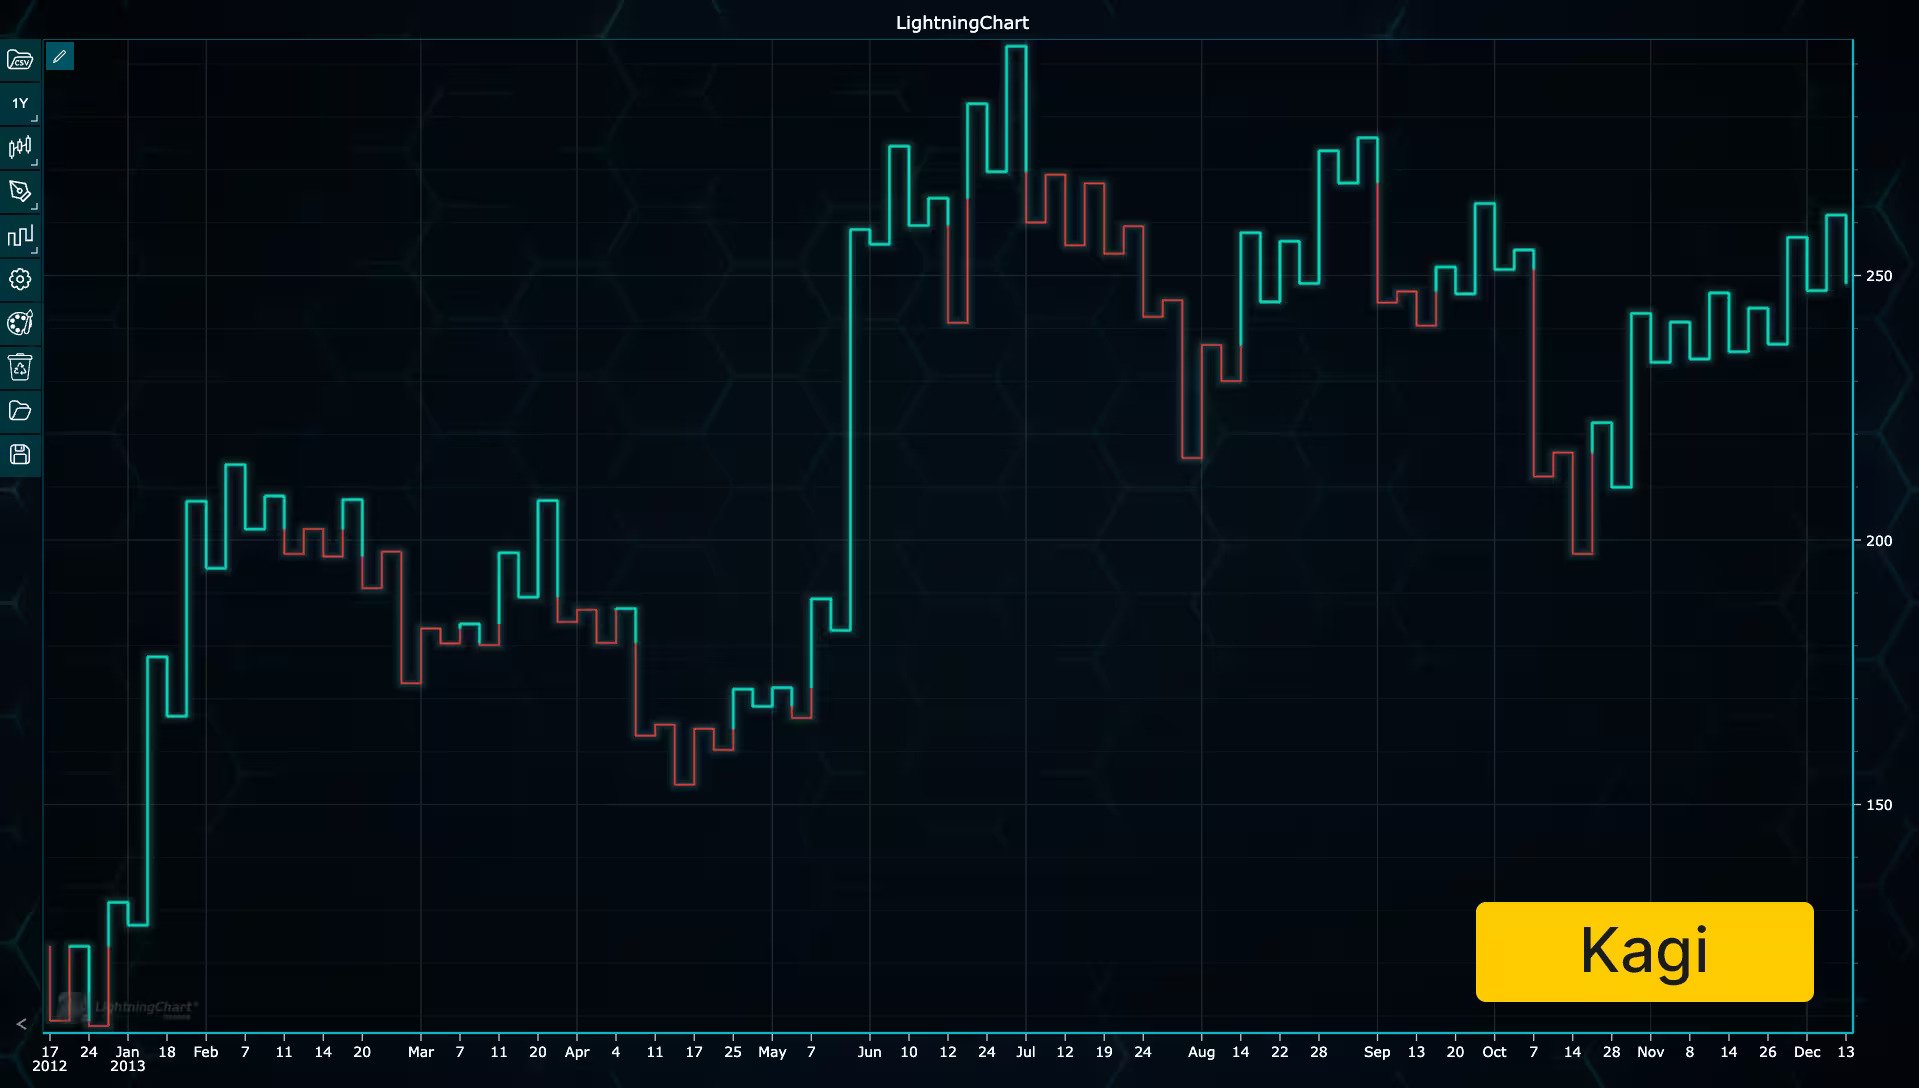
| Kagi |
|
|
| Point & Figure |
|
|
|
Add scientific LightningChart® Python charts
Read more about LightningChart Python scientific and engineering charts
|
$24 USD
|
|
| Ultra-high-performance 2D real-time charts |
|
|
| 3D surface, line and bar charts |
|
|
| Parallel coordinates charts with filters |
|
|
| Polar charts |
|
|
| Map charts |
|
|
| Treemap charts |
|
|
| Gauges |
|
|
|
$75 USD
month / user
|
||
Get LightningChart Python Trader
Get the charting package you need - customize your subscription
Includes
-
100+ built-in technical indicators
 Read the full list of 100+ technical indicators
 -
30+ drawing tools
Read the full list of 30+ drawing tools
- Chart customization
- Interactive controls
- Flexible data inputs
- Save custom templates
- Heatmaps
- External environment integrations
- Technical analysis for real-time data
Join thousands of customers who trust LightningChart technology


Elevate your Python data visualization capabilities to the next level -LightningChart® Python charts enable super-fast 2D and 3D visualizations for large data sets. Create stunning real-time visualizations with instant responsiveness.
Whether you're a data scientist seeking to uncover hidden insights, or a developer building cutting-edge software applications, GPU-accelerated LightningChart® Python charts captivate and engage your audience.


If you have any questions, feel free to contact us!
©LightningChart Ltd 2026. All rights reserved.