


High-Performance Aerospace and Defense Visualizations.
Build mission-critical aerospace and defense data applications with LightningChart’s high-precision charting libraries


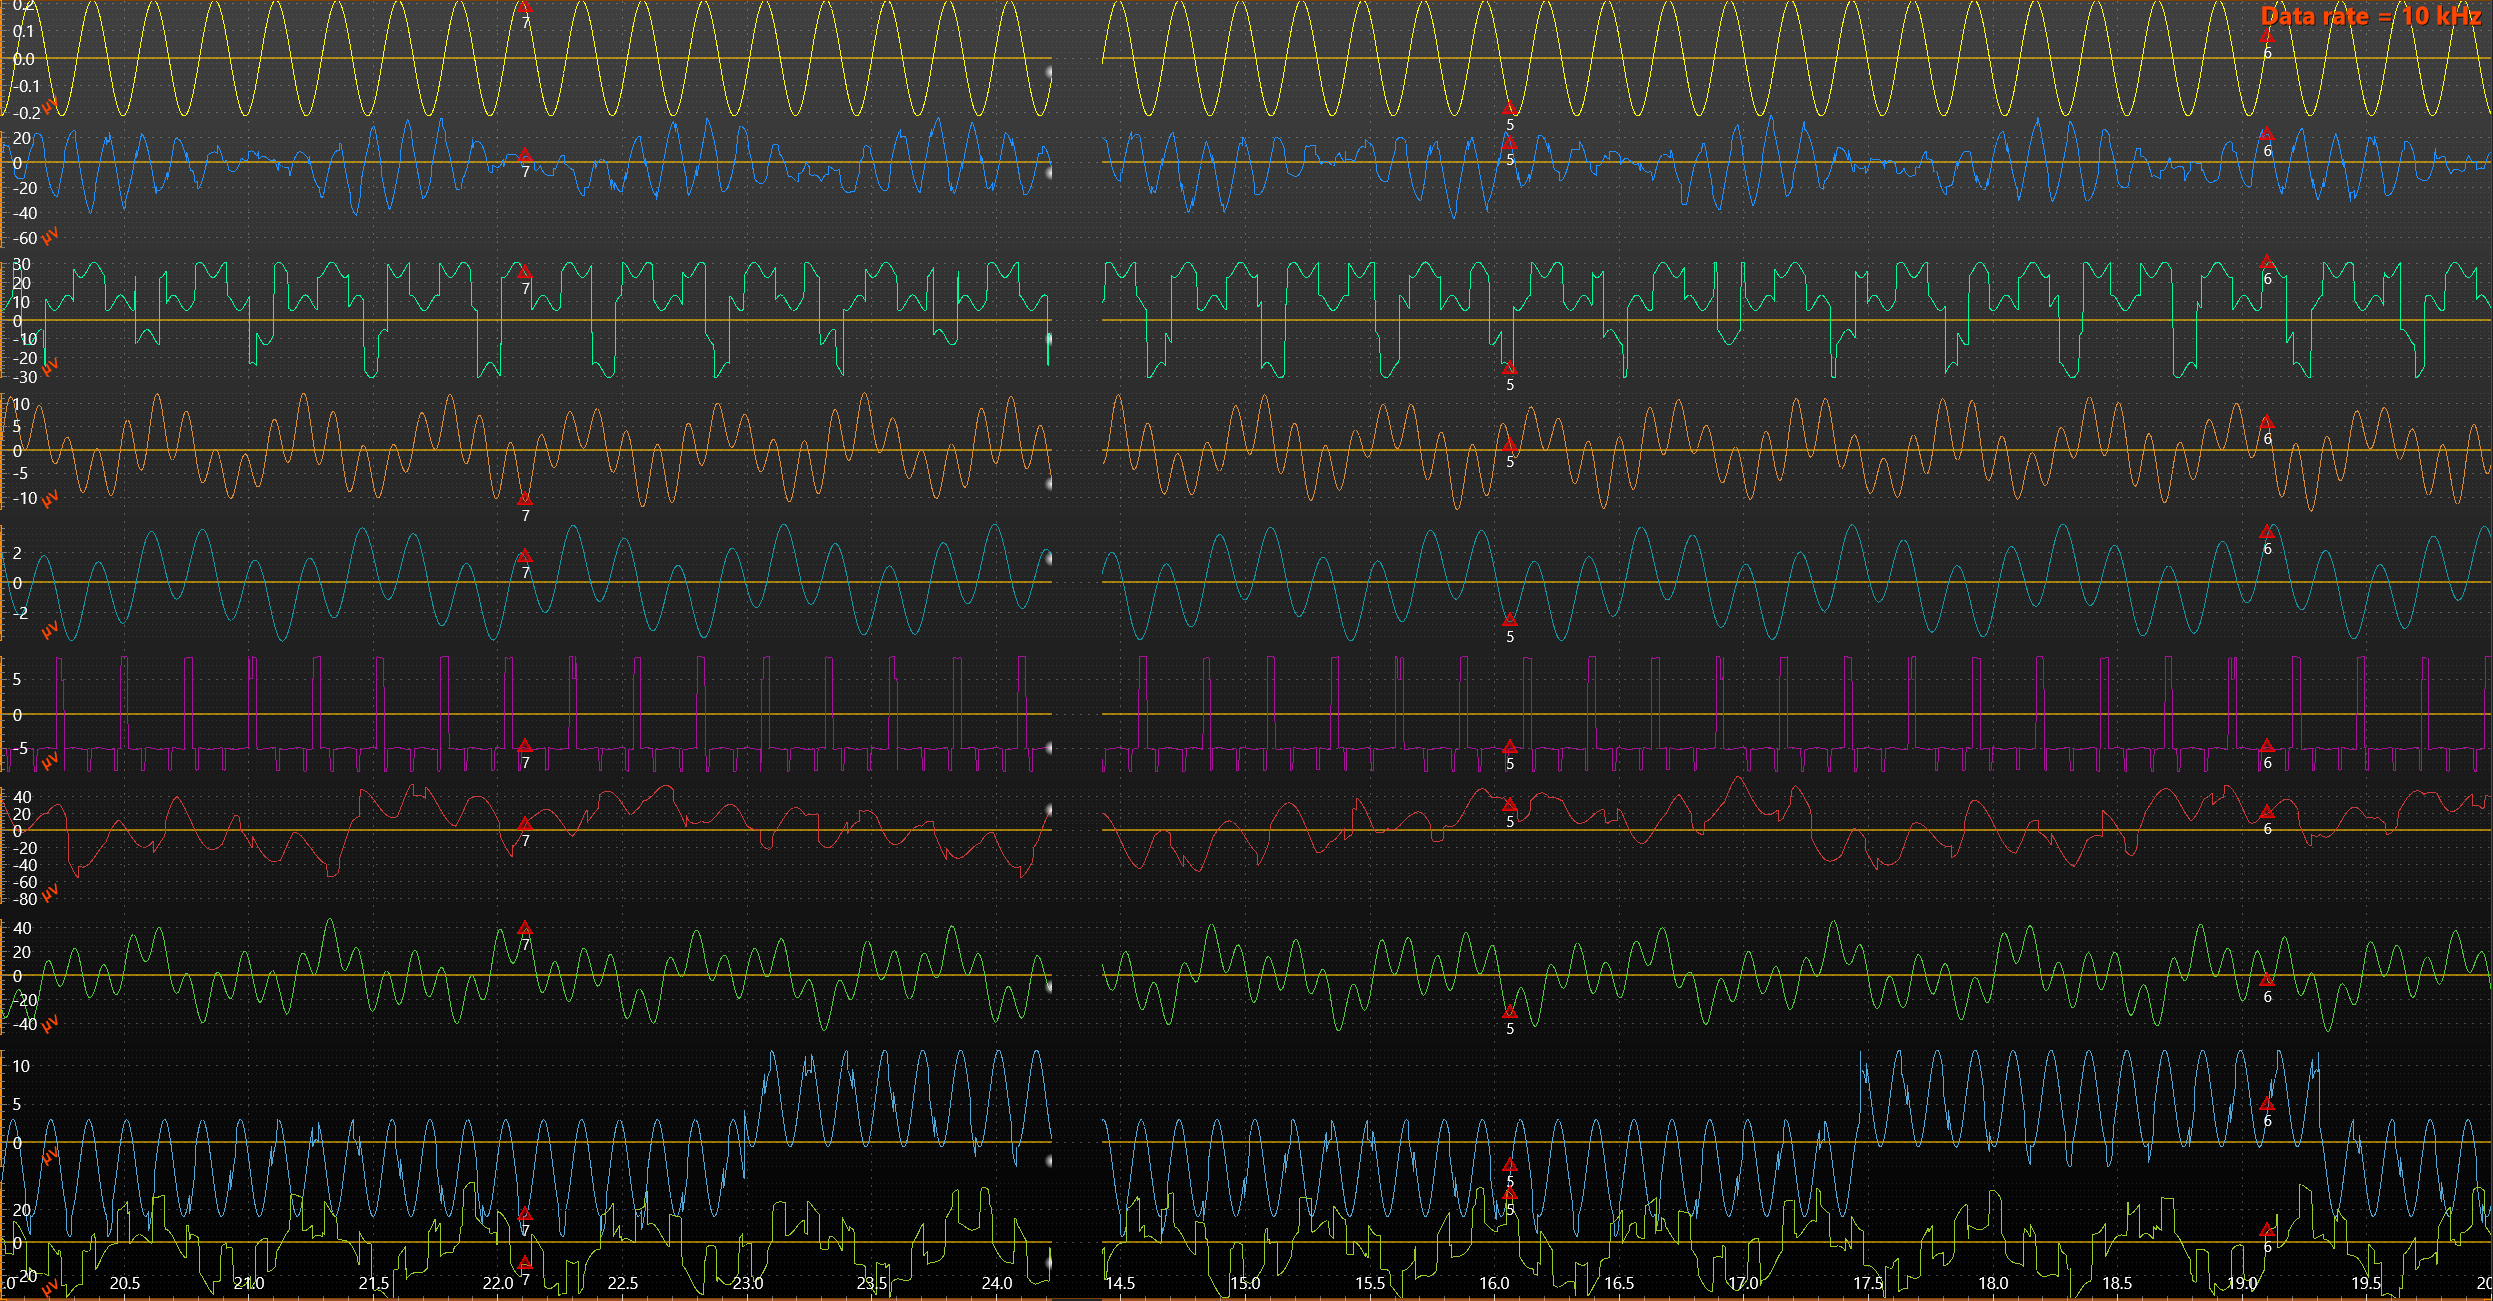
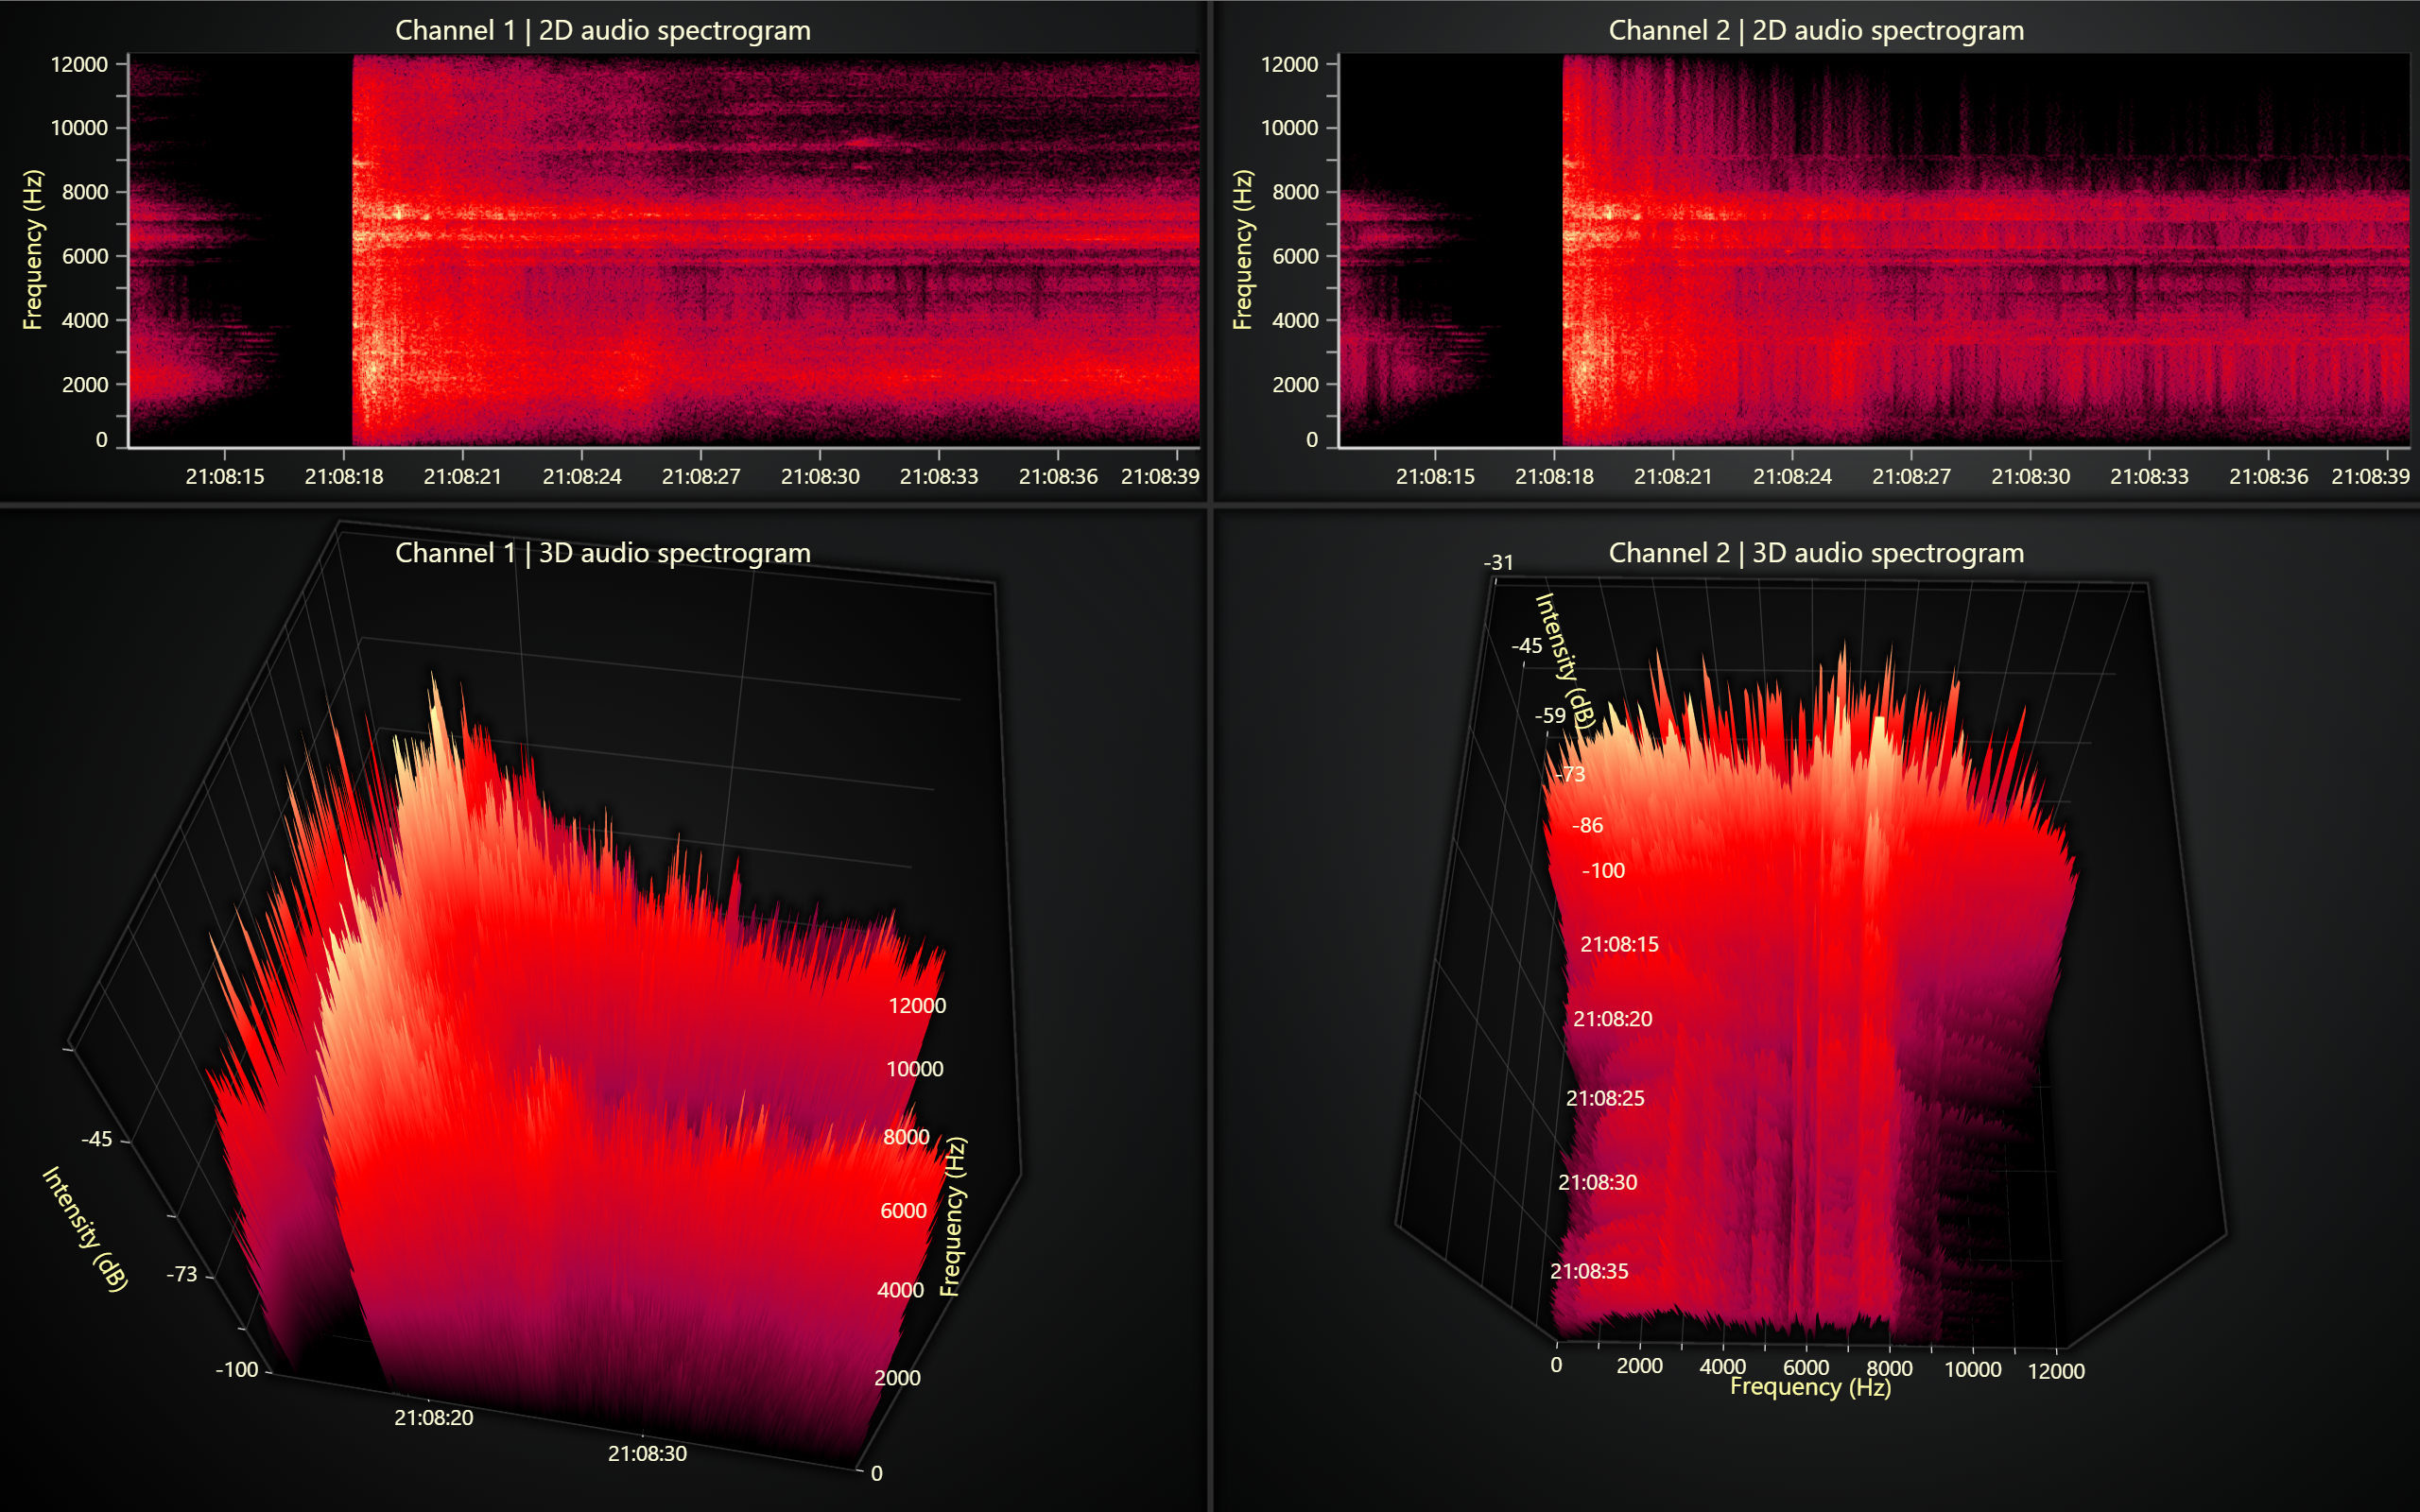
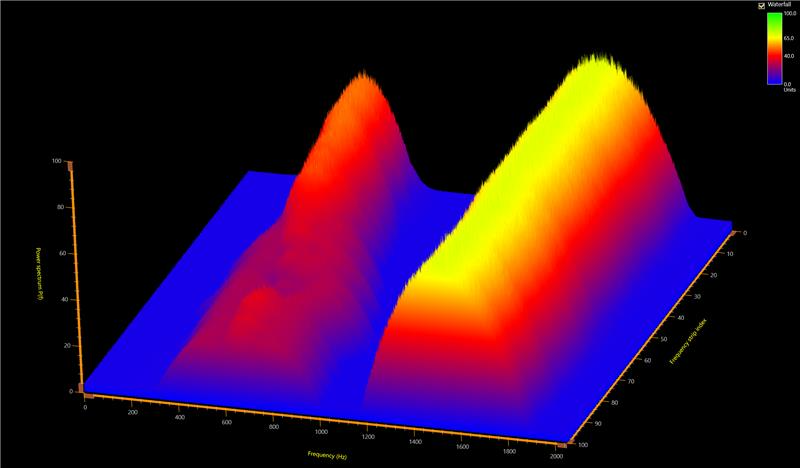
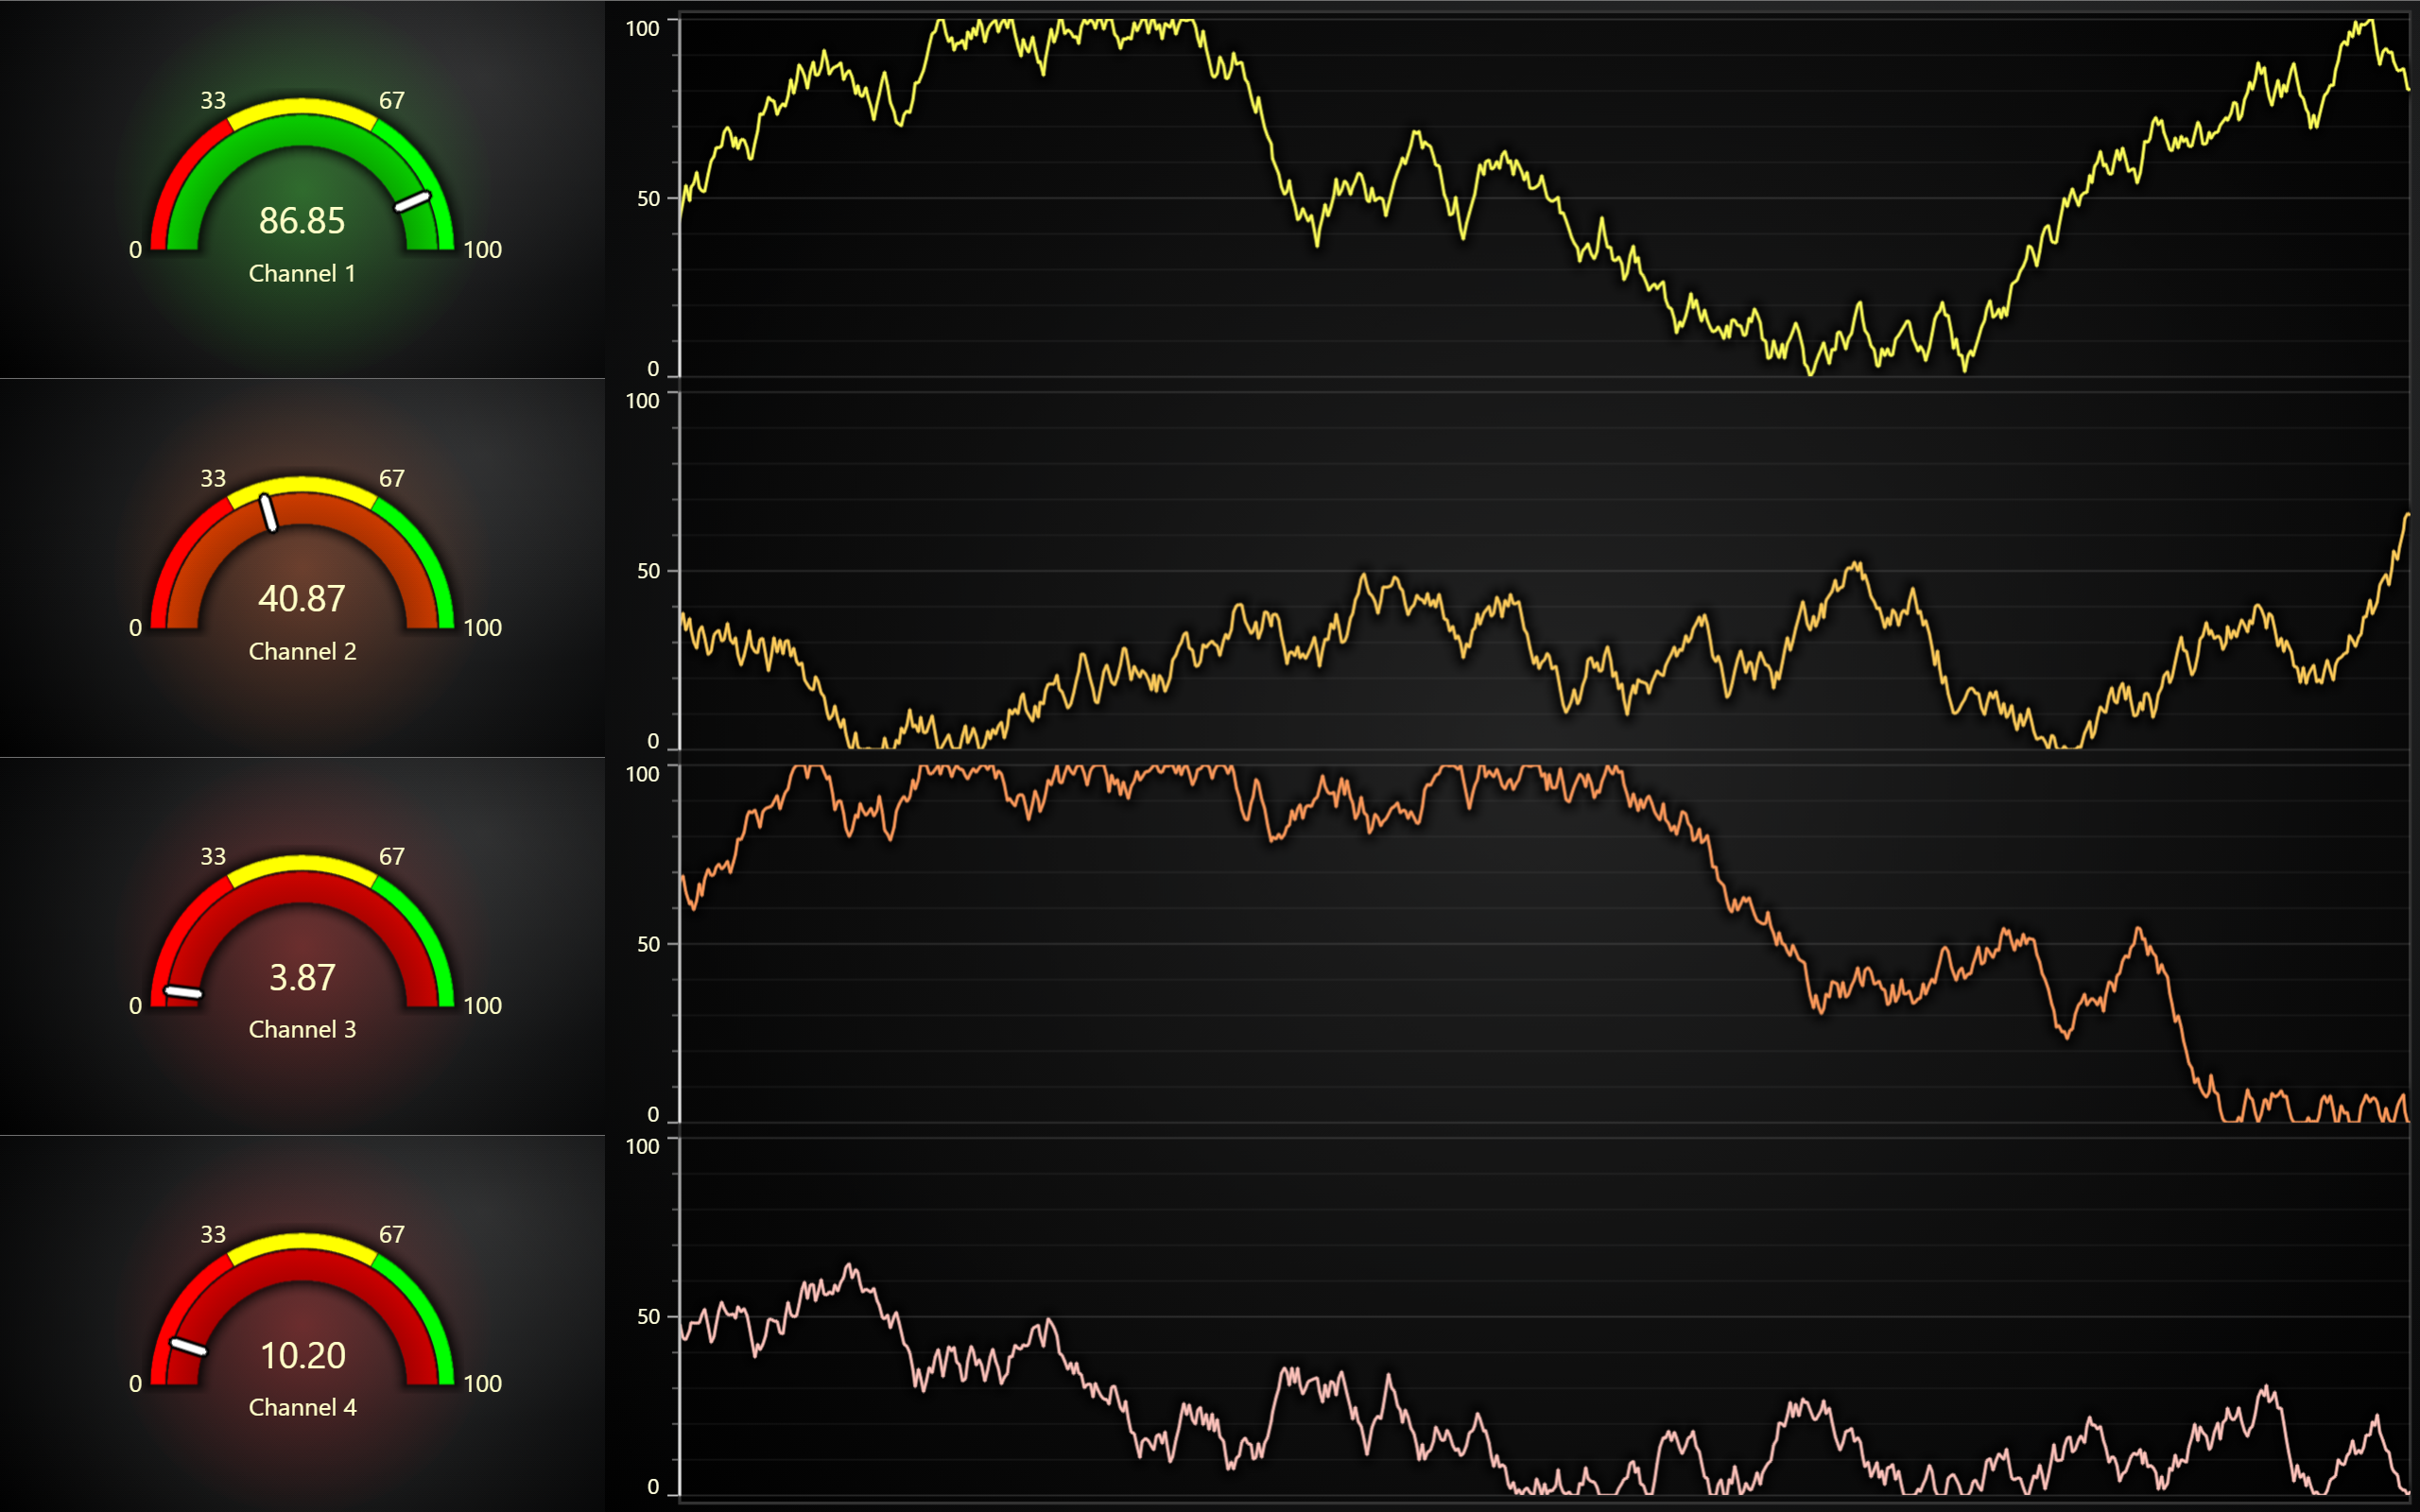
Electronic Warfare & Signal Intelligence
LightningChart enables defense teams to visualize, monitor, and analyze high-frequency signals in real time—critical for electronic warfare, surveillance, and signal intelligence operations.
- Real-time signal logging & spectral analytics
- Signal interception & RF surveillance
- Jamming analysis
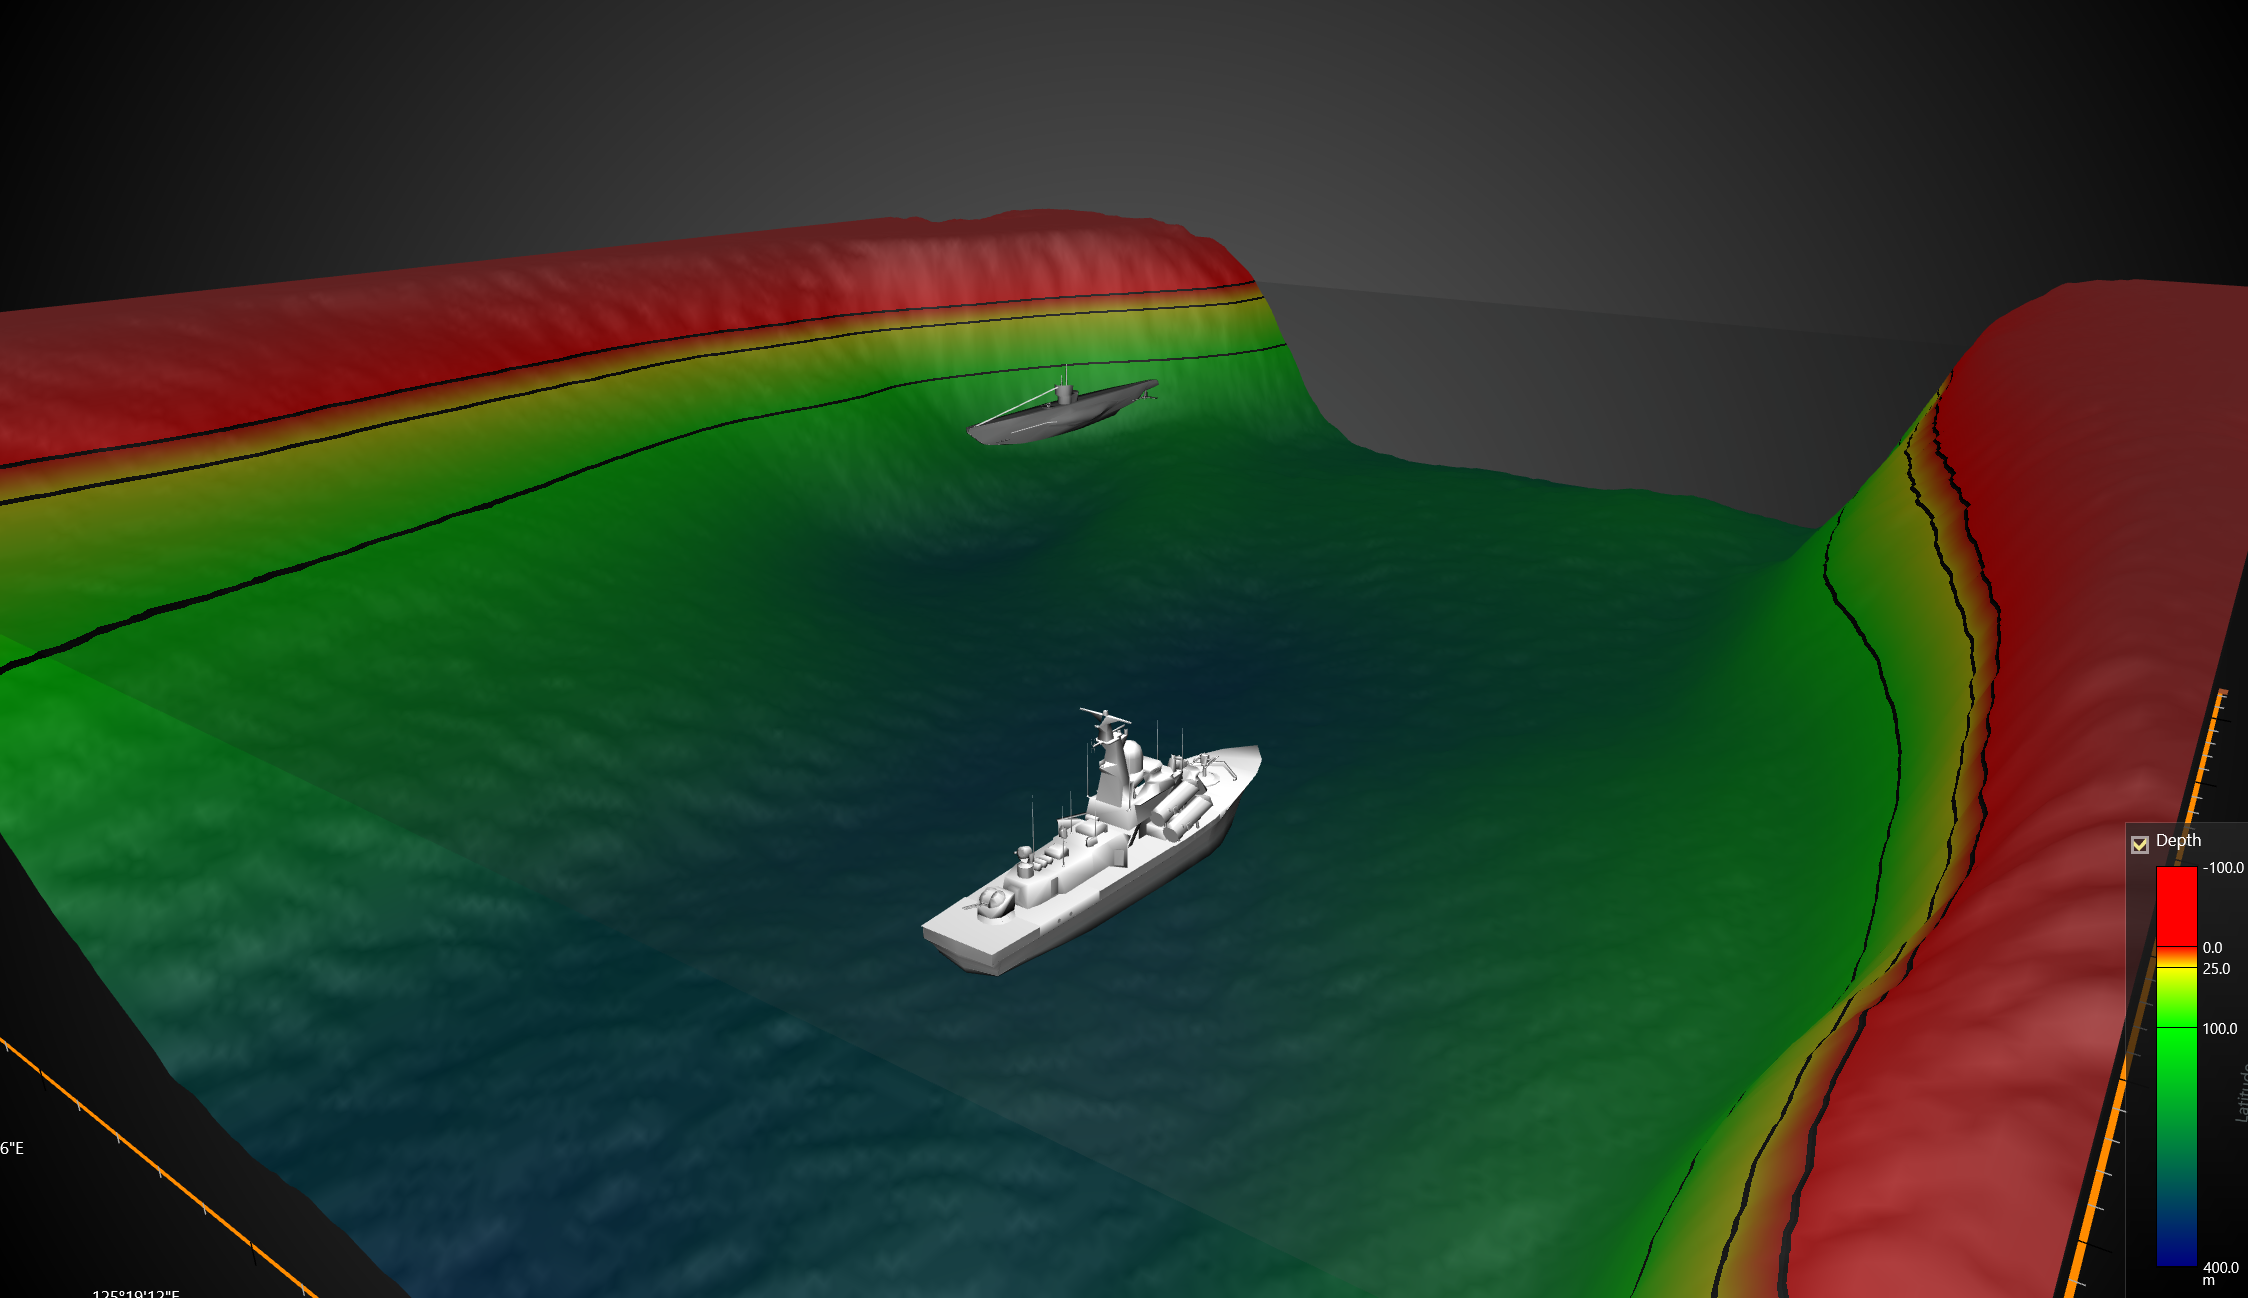
- Target geolocation
Tactical & Flight Operations
From radar feeds to aircraft diagnostics, LightningChart delivers ultra-fast rendering and precise tracking to support air and ground operations with zero compromise on performance.
- Multi-channel spectrum logging with microsecond latency
- Radar system visualizations
- Aircraft live diagnostics


Space & Defense Simulation
LightningChart empowers defense researchers and satellite operations teams with tools for in-depth flight analytics, orbital visualization, and R&D simulation at scale.
- Flight performance analytics
- Satellite telemetry & orbital analysis
- Defense R&D simulations

Why Developers Choose LightningChart
LightningChart is engineered for delivering the fastest-rendering data visualizations, trusted for critical mission success.
Hardware-Accelerated Performance
LightningChart’s visualization controls are GPU-accelerated charts rendered at the highest FPS and fastest load-up speeds.
Functionality
Extensive 2D and 3D charts, fully customizable for high-demand applications including LineSeries, Heatmaps, MapCharts, Surface Grids, and more.
Rich Documentation
Easily get started with plenty of all-level user resources, API documentation, and interactive chart examples.
Trusted by Leaders in Aerospace, Defense, and Advanced Tech
Organizations building mission-critical systems rely on LightningChart for unmatched performance in real-time data visualization. Whether it’s aerospace simulations, defence analytics, or enterprise-grade telemetry, our charting tools deliver the speed, accuracy, and reliability that developers demand.
Our NCAGE code is A970G. An NCAGE code is a unique identifier that shows our company is officially registered as a recognized supplier within the NATO Codification System, allowing us to participate in government and defense-related contracts, confirming our compliance with NATO’s supplier registration standards.

Browse Aerospace and Defense charts
Browse real examples of charts used in advanced monitoring, analytics, and system diagnostics across complex data environments:
Get started
LightningСhart JS
Best for developing web, mobile, desktop, IoT, Cloud, & Intranet applications that require fast data processing times.
The library features 100+ charts, examples source code, & 10+ framework templates including Angular, React, Quasar JS, Ionic, etc.
WebGL-rendered, GPU-accelerated charts for delivering the highest performance & the best user experience.
LightningСhart .NET
Ideal for developing highly demanding desktop applications, e.g., scientific, engineering, finance, medicine, etc.
The library features 100+ chart types, signal tools, and examples source code supported in WinForms, UWP, and WPF.
Hardware-accelerated controls for lightning-fast rendering performance and efficient use of resources
LightningСhart Python
For data scientists, researchers, or educators looking to enhance their data analysis capabilities.
The library features 100+ plot types, compatible with different Python notebooks. Supports PyQt & PySide integration.
WebGL-rendered, GPU-accelerated 2D & 3D plotting library for high performance & the best user experience.


If you have any questions, feel free to contact us!
©LightningChart Ltd 2026. All rights reserved.