How customize DataCursor's ResultTable?
From version 12.4 DataCursor can have customizable content of ResultTable. In particular, after subscribing to DataCursor. ChangeResultContent event, user can use event handle to create a composite format string, which will be used instead of default table. As much as composite format string allows, user can define which values to show in ResultTable, with what precision and how to arrange items (e.g. padding, alignment, multi-lines).
ChangeResultContent event is available for XY, 3D, Polar and Smith views, although event-argument-class is slightly different for each. The event-argument give user access to tracked series, axis values of tacking point and few other parameters.
For multi-line Result-string it is better to use monospaced fonts for nice alignments. For example, "Courier New", "Lucida Sans Typewriter", "Cascadia Mono", "DejaVu Sans Mono" or "Liberation Mono".
Series.Title.Text property can help to identify the object under DataCursor. From version 12.5 there is no need to know specific series type. It is enough to cast to the base class of View (like SeriesBaseXY, SeriesBase3D or SeriesBaseRound) and call series.GetTitleText() method.
Simple ResultTable (XY)
In this example, ResultTable is simplified to bare minimum.
// subscribing to event
_chart.ViewXY.DataCursor.Visible = true;
_chart.ViewXY.DataCursor.ChangeResultContent += ChangeResultContent;
_chart.ViewXY.DataCursor.ShowColorIndicator = false;


// DataCursor event handler
private void ChangeResultContent(object sender, ViewXYDataCursorResultTableFormatEventArgs e)
{
    PointLineSeries pls = e.Series as PointLineSeries;
    if (pls == null) return;

    // Minimalistic output.
    e.ResultContent = String.Format("{0,4:0.0}°C {1,5:0.00}", e.Y, e.X);
}
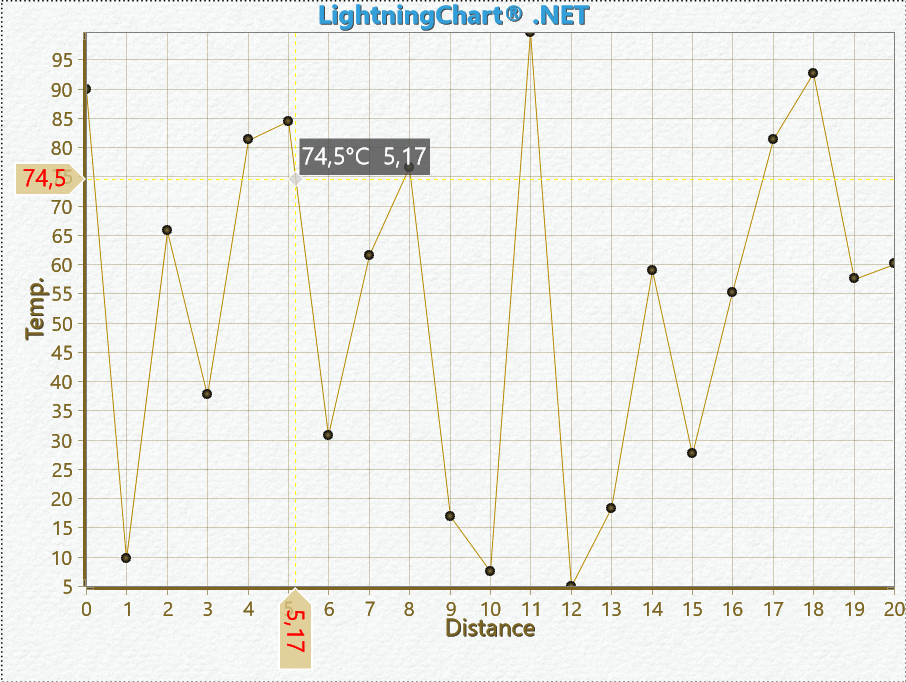 DataCursor example, ResultTable-Simple.
GeoMap ResultTable (XY)
In this example, ResultTable shows geographical map coordinates. Note, that monospaced font is used.
// subscribing to event
_chart.ViewXY.DataCursor.Visible = true;
_chart.ViewXY.DataCursor.ChangeResultContent += ChangeResultContent;

// For multi-line Result-string it is better to use monospaced fonts for nice alignments.
// For example, "Courier New", "Lucida Sans Typewriter", "Cascadia Mono", "DejaVu Sans Mono" or "Liberation Mono".
_chart.ViewXY.DataCursor.Results.DataRowFont = new WpfFont("Courier New", 14);


// DataCursor event handler
private void ChangeResultContent(object sender, ViewXYDataCursorResultTableFormatEventArgs e)
{
    FreeformPointLineSeries series = e.Series as FreeformPointLineSeries;
    if (series == null) return;

    // For multi-line string it is better to use monospaced fonts for nice alignments.
    // Following composite format string titles to the left and values to the right,
    // Each with preferred formatted field width.
    string formatString =
        "{0}\n" + // Title
        "{1,-5}{2,14}\n" + // Lon
        "{3,-5}{4,14}"; // Lat

    string value1 = FormatAsMapCoordinate(e.X, true);
    string value2 = FormatAsMapCoordinate(e.Y, false);

    e.ResultContent = String.Format(formatString,
        series.Title.Text,
        "Lon:", value1,
        "Lat:", value2);
}

private static string FormatAsMapCoordinate(double dVal, bool longitude)
{
    string postFix = longitude ? " E" : " N";
    if (dVal < 0)
    {
        dVal = -dVal;
        postFix = longitude ? " W" : " S";
    }
    int iDegreesIntegerPart = (int)dVal;
    double dMinutes = (dVal - iDegreesIntegerPart) * 60.0;
    int iMinutesIntegerPart = (int)dMinutes;
    double dSeconds = (dMinutes - iMinutesIntegerPart) * 60.0;
    int iSeconds = (int)(dSeconds + 0.5);

    //Fix inaccurate values
    if (iSeconds == 60)
    {
        iMinutesIntegerPart++;
        iSeconds = 0;
    }
    if (iMinutesIntegerPart == 60)
    {
        iDegreesIntegerPart++;
        iMinutesIntegerPart = 0;
    }
    return string.Format("{0}°{1:00}'{2:00}\"", iDegreesIntegerPart, iMinutesIntegerPart, iSeconds) + postFix;
}
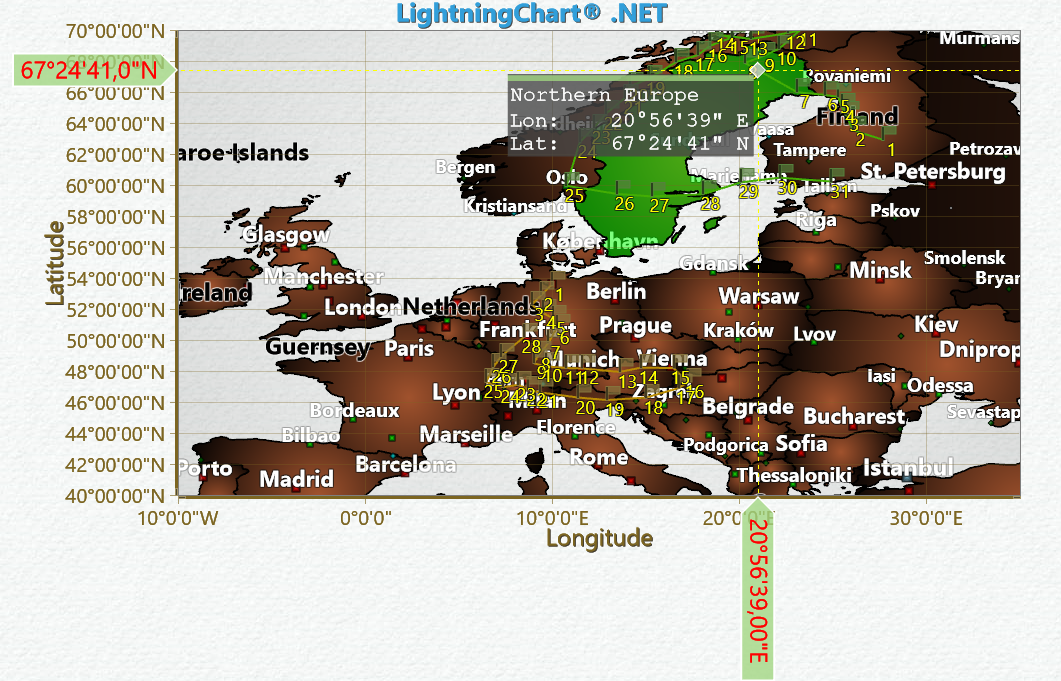 DataCursor example, ResultTable-GeoMap.
Heatmap ResultTable (XY)
In this example, ResultTable shows IntesityGridSeries values.
// subscribing to event
_chart.ViewXY.DataCursor.Visible = true;
_chart.ViewXY.DataCursor.ChangeResultContent += ChangeResultContent;


// DataCursor event handler
private void ChangeResultContent(object sender, ViewXYDataCursorResultTableFormatEventArgs e)
{
    IntensitySeriesBase series = (IntensitySeriesBase)e.Series;
    if (series == null) return;

    string formatString =
        "{0}\n" +
        "  {1,-12}{2,8:0.00} {3}\n" +
        "  {4,-12}{5,8:0.00} {6}\n" +
        "  Value:{7,16:0.00}";

    double value1 = e.X;
    double value2 = e.Y;
    double value3 = e.Value;
    Color color = e.Color;
    String strSeriesTitle = series.Title.Text;
    String strXAxisTitle = _chart.ViewXY.XAxes[series.AssignXAxisIndex].Title.Text + ":";
    String strYAxisTitle = _chart.ViewXY.YAxes[series.AssignYAxisIndex].Title.Text + ":";
    String strXAxisUnits = _chart.ViewXY.XAxes[series.AssignXAxisIndex].Units.Text;
    String strYAxisUnits = _chart.ViewXY.YAxes[series.AssignYAxisIndex].Units.Text;

    e.ResultContent = String.Format(formatString,
        strSeriesTitle,
        strXAxisTitle, value1, strXAxisUnits,
        strYAxisTitle, value2, strYAxisUnits, value3);
}
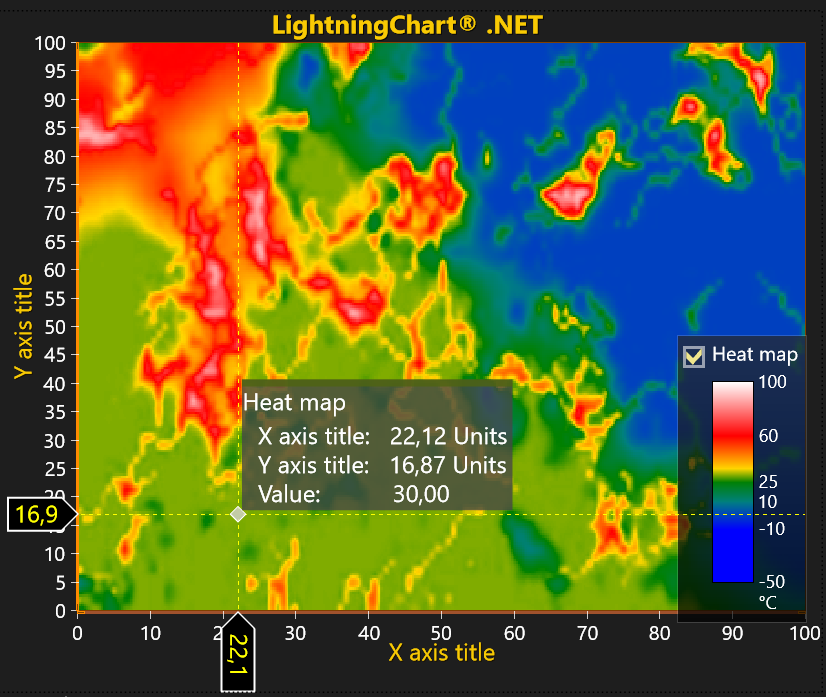 DataCursor example, ResultTable-Heatmap.
ResultTable with multiple series
In this example, ResultTable shows combined result from all series at the same point-index as primary tracked series.
// subscribing to event
_chart.ViewXY.DataCursor.Visible = true;
_chart.ViewXY.DataCursor.ChangeResultContent += ChangeResultContent;
viewXY.DataCursor.ShowColorIndicator = false;       // we will try to show all Series in the same table

// DataCursor event handler
private void DataCursor_ChangeResultContent(object sender, ViewXYDataCursorResultTableFormatEventArgs e)
{
    PointLineSeries series = e.Series as PointLineSeries;
    if (series == null) return;

    int iIndex = (int)e.PrimaryDataIndex;
    AxisX axisX = _chart.ViewXY.XAxes[0];
    AxisY axisY = _chart.ViewXY.YAxes[0];
    if (e.X <= series.Points[iIndex].X)
        --iIndex;
    // Show values of all series from same index.
    string strResult = "Y-Values at X: " + e.X.ToString("0.00") + "\n\n";
    double startX = series.Points[iIndex].X;
    double endX = series.Points[iIndex + 1].X;
    double dDiffX = endX - startX;
    float[] coordsX = axisX.ValuesToCoords(new double[] { startX, endX }, false);
    double dXCoeff = (e.PointerCoordX - coordsX[0]) / (coordsX[1] - coordsX[0]);
    foreach (PointLineSeries pointLineSeries in _chart.ViewXY.PointLineSeries)
    {
        if (iIndex - 1 < pointLineSeries.Points.Length)
        {
            double startY = pointLineSeries.Points[iIndex].Y;
            double endY = pointLineSeries.Points[iIndex + 1].Y;
            double dDiffY = endY - startY;
            double value = startY + dXCoeff * dDiffY;

            strResult += pointLineSeries.Title.Text + ": " + value.ToString("0.00")  +"\n";
        }
    }
    strResult = strResult.TrimEnd('\n');
    e.ResultContent = strResult;
}
 DataCursor example, ResultTable with multiple series.
ResultTable 3D
In this example, ResultTable shows multi-line 3D results arrangement.
// subscribing to event
_chart.View3D.DataCursor.Visible = true;
_chart.View3D.DataCursor.ChangeResultContent += DataCursor_ChangeResultContent;

// DataCursor event handler
private void DataCursor_ChangeResultContent(object sender, View3DDataCursorResultTableFormatEventArgs e)
{
    PointLineSeries3D series = e.Series as PointLineSeries3D;
    if (series == null) return;

    string formatString = "{0}\n    {1,-12}{2,8:0.00} {3}\n    {4,-12}{5,8:0.00} {6}\n    {7,-12}{8,8:0.00} {9}";

    double value1 = e.X;
    double value2 = e.Y;
    double value3 = e.Z;
    String strSeriesTitle = series.Title.Text;
    String strXAxisTitle = _chart.View3D.XAxisPrimary3D.Title.Text + ":";
    String strYAxisTitle = _chart.View3D.YAxisPrimary3D.Title.Text + ":";
    String strZAxisTitle = _chart.View3D.ZAxisPrimary3D.Title.Text + ":";
    String strXAxisUnits = _chart.View3D.XAxisPrimary3D.Units.Text;
    String strYAxisUnits = _chart.View3D.YAxisPrimary3D.Units.Text;
    String strZAxisUnits = _chart.View3D.ZAxisPrimary3D.Units.Text;

    e.ResultContent = String.Format(formatString, strSeriesTitle, strXAxisTitle, value1, strXAxisUnits, strYAxisTitle, value2, strYAxisUnits, strZAxisTitle, value3, strZAxisUnits);
}
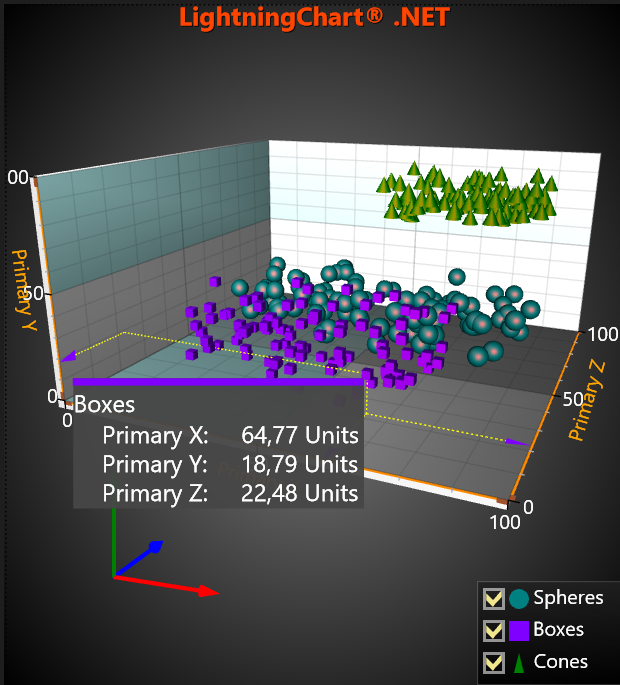 DataCursor example, ResultTable 3D.
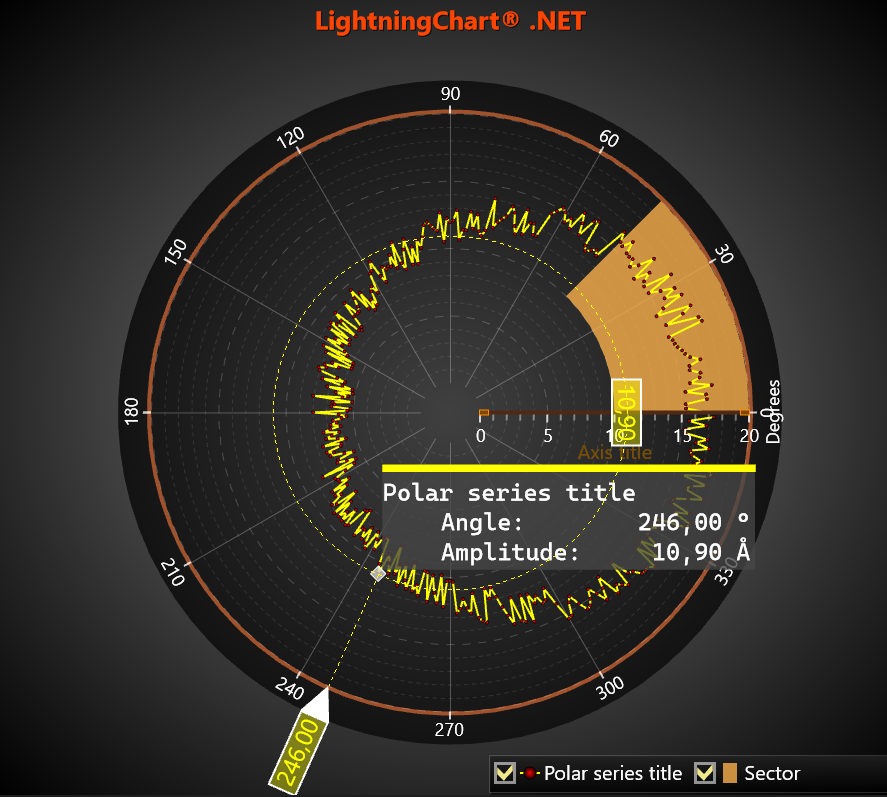
ResultTable Polar line
In this example, ResultTable shows multi-line Polar results arrangement. Note, that monospaced font is used.
// subscribing to event
_chart.ViewPolar.DataCursor.Visible = true;
_chart.ViewPolar.DataCursor.ChangeResultContent += DataCursor_ChangeResultContent;
_chart.ViewPolar.DataCursor.ShowResultTable = true;

// For multi-line Result-string it is better to use monospaced fonts for nice alignments.
// For example, "Courier New", "Lucida Sans Typewriter", "Cascadia Mono", "DejaVu Sans Mono" or "Liberation Mono".
_chart.ViewPolar.DataCursor.Results.DataRowFont = new WpfFont("Cascadia Mono", 16.0, "16", false, false);


// DataCursor event handler
private void DataCursor_ChangeResultContent(object sender, ViewPolarDataCursorResultTableFormatEventArgs e)
{
    PointLineSeriesPolar pls = e.Series as PointLineSeriesPolar;
    if (pls == null) return;

    // For multi-line string it is better to use monospaced fonts for nice alignments.
    // Following composite format string titles to the left and values to the right,
    // Each with preferred formatted field width.
    string formatString =
        "{0}\n" +
        "    {1,-12}{2,8:0.00} {3}\n" +
        "    {4,-12}{5,8:0.00} {6}";

    double angle = e.Angle;
    double amplitude = e.Amplitude;
    String strSeriesTitle = pls.Title.Text;

    AxisPolar axis = _chart.ViewPolar.Axes[0];

    String strAngleTitle = "Angle:";
    String strAngleUnits = "°";
    String strAmplitudeTitle = "Amplitude:";
    String strAmplitudeUnits = "Å";

    e.ResultContent = String.Format(formatString,
        strSeriesTitle,
        strAngleTitle, angle, strAngleUnits,
        strAmplitudeTitle, amplitude, strAmplitudeUnits);
}
 DataCursor example, ResultTable Polar line.
ResultTable Polar heatmap
In this example, ResultTable shows multi-line results arrangement for IntensityGridSeriesPolar. Note, that monospaced font is used.
// subscribing to event
_chart.ViewPolar.DataCursor.Visible = true;
_chart.ViewPolar.DataCursor.ChangeResultContent += DataCursor_ChangeResultContent;
_chart.ViewPolar.DataCursor.ShowResultTable = true;

// For multi-line Result-string it is better to use monospaced fonts for nice alignments.
// For example, "Courier New", "Lucida Sans Typewriter", "Cascadia Mono", "DejaVu Sans Mono" or "Liberation Mono".
_chart.ViewPolar.DataCursor.Results.DataRowFont = new WpfFont("DejaVu Sans Mono", 16.0, "16", false, false);


// DataCursor event handler
private void DataCursor_ChangeResultContent(object sender, ViewPolarDataCursorResultTableFormatEventArgs e)
{
    IntensityGridSeriesPolar pls = e.Series as IntensityGridSeriesPolar;
    if (pls == null) return;

    // For multi-line string it is better to use monospaced fonts for nice alignments.
    // Following composite format string titles to the left and values to the right,
    // Each with preferred formatted field width.
    string formatString =
        "{0}\n" +
        "    {1,-12}{2,8:0.00} {3}\n" +
        "    {4,-12}{5,8:0.00} {6}\n" +
        "    {7,-12}{8,8:0.00} {9}";

    double angle = e.Angle;
    double amplitude = e.Amplitude;
    double value = e.Value;
    String strSeriesTitle = pls.Title.Text;

    AxisPolar axis = _chart.ViewPolar.Axes[0];

    String strAngleTitle = "Angle:";
    String strAngleUnits = "°";
    String strAmplitudeTitle = "Amplitude:";
    String strAmplitudeUnits = "Å";
    String strValueTitle = "Value:";
    String strValueUnits = "";

    e.ResultContent = String.Format(formatString,
        strSeriesTitle,
        strAngleTitle, angle, strAngleUnits,
        strAmplitudeTitle, amplitude, strAmplitudeUnits,
        strValueTitle, value, strValueUnits);
}
 DataCursor example, ResultTable Polar heatmap.
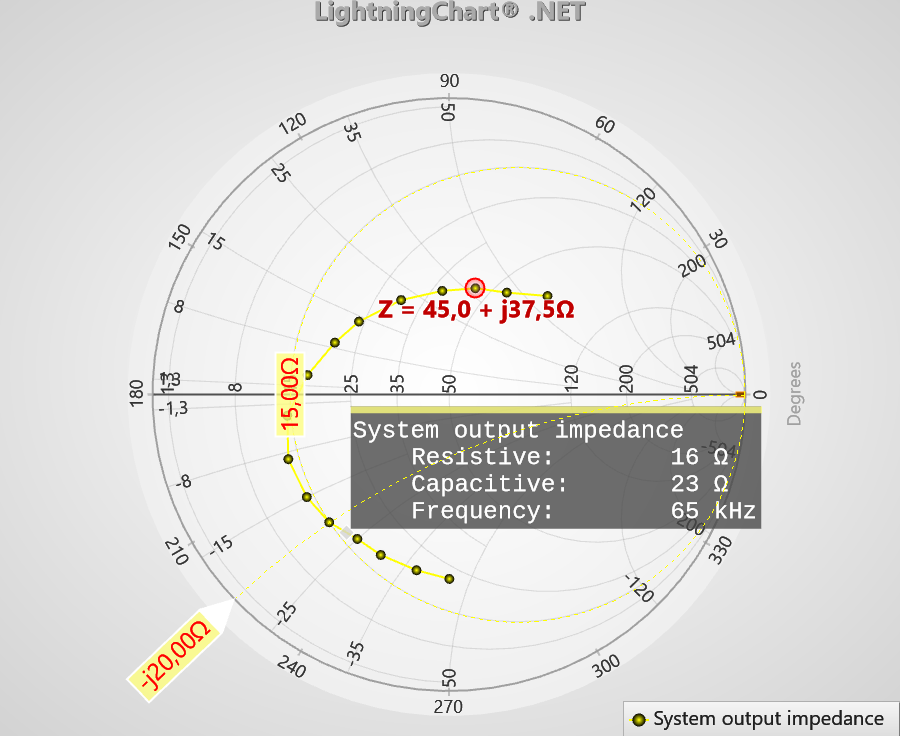
ResultTable Smith line
In this example, ResultTable shows multi-line Smith results arrangement. Note, that monospaced font is used.
// subscribing to event
_chart.ViewSmith.DataCursor.Visible = true;
_chart.ViewSmith.DataCursor.ShowResultTable = true;
_chart.ViewSmith.DataCursor.ChangeResultContent += DataCursor_ChangeResultContent;

// For multi-line Result-string it is better to use monospaced fonts for nice alignments.
// For example, "Courier New", "Lucida Sans Typewriter", "Cascadia Mono", "DejaVu Sans Mono" or "Liberation Mono".
_chart.ViewSmith.DataCursor.Results.DataRowFont = new WpfFont("Liberation Mono", 16.0, "16", false, false);


// DataCursor event handler
private void DataCursor_ChangeResultContent(object sender, ViewSmithDataCursorResultTableFormatEventArgs e)
{
    PointLineSeriesSmith pls = e.Series as PointLineSeriesSmith;
    if (pls == null) return;

    // For multi-line string it is better to use monospaced fonts for nice alignments.
    // Following composite format string titles to the left and values to the right,
    // Each with preferred formatted field width.
    string formatString =
        "{0}\n" +
        "    {1,-12}{2,8:0} {3}\n" +
        "    {4,-12}{5,8:0} {6}\n" +
        "    {7,-12}{8,8:0} {9}";

    double resistance = e.Re;
    double reactance = e.Im;
    string strSeriesTitle = pls.Title.Text;
    string freqUnits = "Hz";
    object tag = e.Tag;
    double dTag = (int)e.Tag;
    if (1000 <= dTag)
    {
        dTag /= 1000;
        freqUnits = "kHz";
        tag = dTag.ToString("0");
    }

    string strResistanceTitle = "Resistive:";
    string strResistanceUnits = "Ω";
    string strReactanceTitle = reactance < 0 ? "Capacitive:" : "Inductive:";
    string strTagTitle = "Frequency:";

    e.ResultContent = String.Format(formatString,
        strSeriesTitle,
        strResistanceTitle, resistance, strResistanceUnits,
        strReactanceTitle, Math.Abs(reactance), strResistanceUnits,
        strTagTitle, tag, freqUnits);
}
 DataCursor example, ResultTable Smith line.
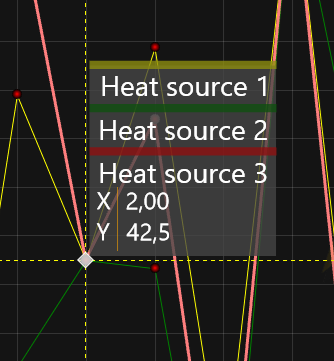
Multiple ResultTable or overlapping series
If line-series overlap and DataCursor is tracking such overlapping points/lines, then DataCursor's ResultTable will have more information than usual. Standard ResultTable would show multiple title and color indicators followed by one set of values.
 DataCursor example, overlapping series (default rendering).
In contrast, for customized ResultTable each series raise ChangeResultContent event and ResultContent strings will be stacked. It can be avoided by canceling other than first events. For example, one can create list of result-strings, which emptied before rendering and filled in ChangeResultContent event handler. If that list is not empty during ChangeResultContent event (and new string is same as one in the list), then just exist event handler.
_chart.BeforeRendering += _chart_BeforeRendering;

List<string> _listResult = new List<string>();

private void _chart_BeforeRendering(object sender, BeforeRenderingEventArgs e)
{
    _listResult.Clear();
}

private void ChangeResultContent(object sender, ViewXYDataCursorResultTableFormatEventArgs e)
{
    PointLineSeries pls = e.Series as PointLineSeries;
    if (pls == null) return;

    string strResults = String.Format("{0,4:0.0}°C {1,5:0.00}", e.Y, e.X);

    if (_listResult.Count > 0 && strResults.Equals(_listResult[0]))
        return;

    e.ResultContent = strResults;
    _listResult.Add(e.ResultContent);
}