


LightningChart JSQlick Data Visualization Add-Ons
Add-OnImprove your data visualization in Qlik with LightningChart open-source extensions.
Introduction
LightningChart JS has developed two data visualization add-ons for Qlik. These extensions are perfect for you if you’re familiar with Qlik data visualization and BI systems. The extensions are for XY charts and 3D charts.
Additionally, LightningChart has released several other data visualization templates that’ll help you integrate LightningChart JS charting library into your project development.
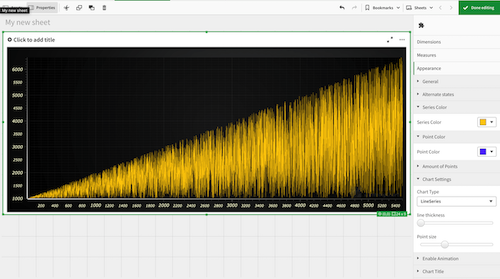
XY Charts Add-On for Qlik
The following extension has been tested with 1 million data points. The purpose of using the LightningChart data visualization extension for Qlik is to allow you to create fully customizable XY charts.

With this Qlik data visualization add-on, you can:
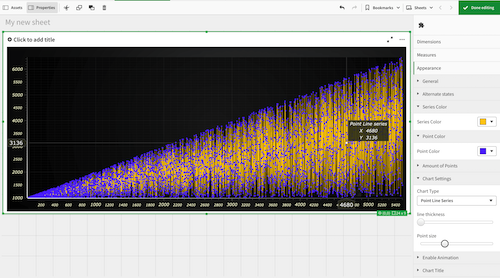
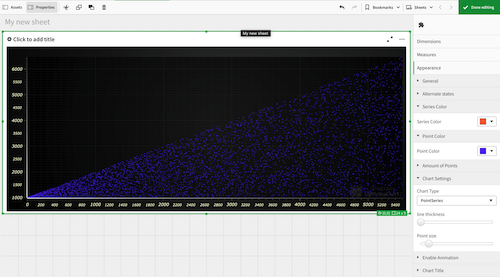
- select the chart’s series type that you need to use, e.g., line series, point line series, or point series.
- set the color of the line series.
- set the color of the points, if you selected the point line series or point series.
- enable or disable the animation.
- set the thickness of the lines.
- set the size of the points.
- set the title of the chart.
XY charts examples
3D Charts Add-On for Qlik
The following extension has been tested with 100,000 data points. With the LightningChart data visualization extension for Qlik you can create 3D charts that are currently not available in the default library of the SaaS.
With this add-on, you can create fully customizable 3D charts and expand its customization by referring to our code to create more and advanced 3D charts such as 3D bar charts, 3D mesh charts, or 3D surface charts. For more examples, please visit our interactive JavaScript examples.

With this Qlik data visualization add-on, you can:
- change the point size.
- change the color.
- set the titles for each of the axes.
- set the title for the chart.
- set a predefined amount of points rendered.
Usage & Installation
Both XY and 3D charts extensions are open-source and only require a license. The Qlik data visualization add-ons can be obtained from GitHub:
NOTE:
As Qlik Sense does not support WebGL rendering, the user will experience a significant drop in the charts’ performance compared to the performance levels of LightningChart JS. In order to get the highest possible performance, please use Qlik Cloud or a web browser.
To install, place folder with selected Extension to C:\Users<User Name>\Documents\Qlik\Sense\Extensions or in QlikCloud */qlikcloud.com/console/extensions/ -> ‘Add’ and upload extension.zip folder. To use the extension in QlikCloud go to ****/qlikcloud.com/explore/spaces/all and press ‘Add new’
Dashtera
In 2025, LightningChart released its own data visualization platform, Dashtera, designed as a no-code solution that empowers non-developers to create advanced dashboards and analyze data interactively.
With Dashtera, users can create eye-catching, super-fast, instantly responsive dashboards in minutes. The platform is powered by LightningChart’s world’s fastest GPU-accelerated technology and optimized data feeds designed for handling masses of 2D and 3D data in real time.

Conclusion
While the LightningChart JS add-ons for Qlik bring powerful XY and 3D charting capabilities to an established BI environment, their functionality remains bound by Qlik’s framework and user interface limitations. Dashtera, on the other hand, represents LightningChart’s complete evolution in data visualization — a standalone, no-code platform built from the ground up to deliver unmatched performance, flexibility, and ease of use.
By combining LightningChart’s GPU-accelerated rendering engine with optimized data feeds for massive 2D and 3D datasets, Dashtera offers users a faster, more interactive, and visually engaging experience than what’s achievable through embedded extensions. It’s the next logical step for anyone looking to go beyond integrations and unlock the full potential of real-time, high-performance data visualization.
Continue learning with LightningChart

React Charting Performance
Here's a scenario that plays out across development teams every few months. Someone builds a React dashboard, picks Recharts or Victory because they're popular, the devs love them, and the first demo looks great. Then the dataset gets bigger. Or the data starts...

Javascript Charting Library comparison 2026
Every year someone publishes a listicle of JavaScript charting libraries. They screenshot a demo, note the GitHub stars, paste in the npm install command, and call it a day. Then you follow their recommendation, get six months into your project, and discover that your...

Visualizing 10 Million Data Points in the Browser (2026): The Technical Deep-Dive
Ten Million Data Points in the Browser: How WebGL Makes Mass Datasets Interactive Ten million data points. That number used to mean a database problem, not a front-end problem. Now research teams want to explore it interactively in a browser. Trading desks want...


If you have any questions, feel free to contact us!
©LightningChart Ltd 2025. All rights reserved.