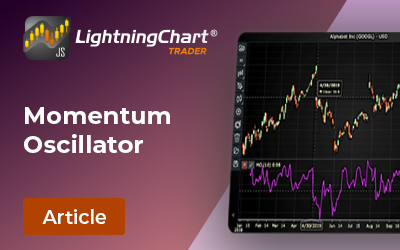
What is the Momentum Oscillator Indicator?The Momentum Oscillator is a pivotal tool in technical analysis, offering...


Regional Account & Marketing Executive (China, Japan and South Korea)
+358 503 543 706
Book a meeting
Regional Account Manager (North America, South America)
+358 505 528 995
Book a meetingOur dedicated sales team is ready to help you find the perfect solution for your data visualization needs. Don't hesitate to reach out for personalized assistance or to schedule a demo of our products.

Regional Account & Marketing Executive (China, Japan and South Korea)
+358 503 543 706
Book a meetingRegional Account Manager (North America, South America)
+358 505 528 995
Book a meetingOur dedicated sales team is ready to help you find the perfect solution for your data visualization needs. Don't hesitate to reach out for personalized assistance or to schedule a demo of our products.


What is the Momentum Oscillator Indicator?The Momentum Oscillator is a pivotal tool in technical analysis, offering...
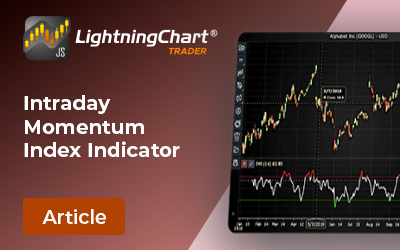
What is the Intraday Momentum Index Indicator?The Intraday Momentum Index (IMI) is a powerful technical analysis tool...

Introduction to Fractal Chaos OscillatorThe Fractal Chaos Oscillator (FCO) is a technical indicator that measures...
The page you requested could not be found. Try refining your search, or use the navigation above to locate the post.