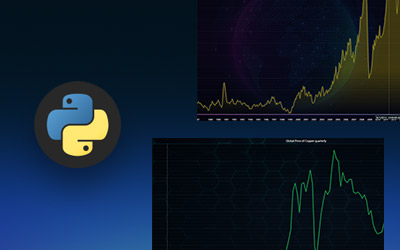
IntroductionThis article demonstrates how to visualize commodity prices using the charting features of the...


Regional Account & Marketing Executive (China, Japan and South Korea)
+358 503 543 706
Book a meeting
Regional Account Manager (North America, South America)
+358 505 528 995
Book a meetingOur dedicated sales team is ready to help you find the perfect solution for your data visualization needs. Don't hesitate to reach out for personalized assistance or to schedule a demo of our products.

Regional Account & Marketing Executive (China, Japan and South Korea)
+358 503 543 706
Book a meetingRegional Account Manager (North America, South America)
+358 505 528 995
Book a meetingOur dedicated sales team is ready to help you find the perfect solution for your data visualization needs. Don't hesitate to reach out for personalized assistance or to schedule a demo of our products.


IntroductionThis article demonstrates how to visualize commodity prices using the charting features of the...

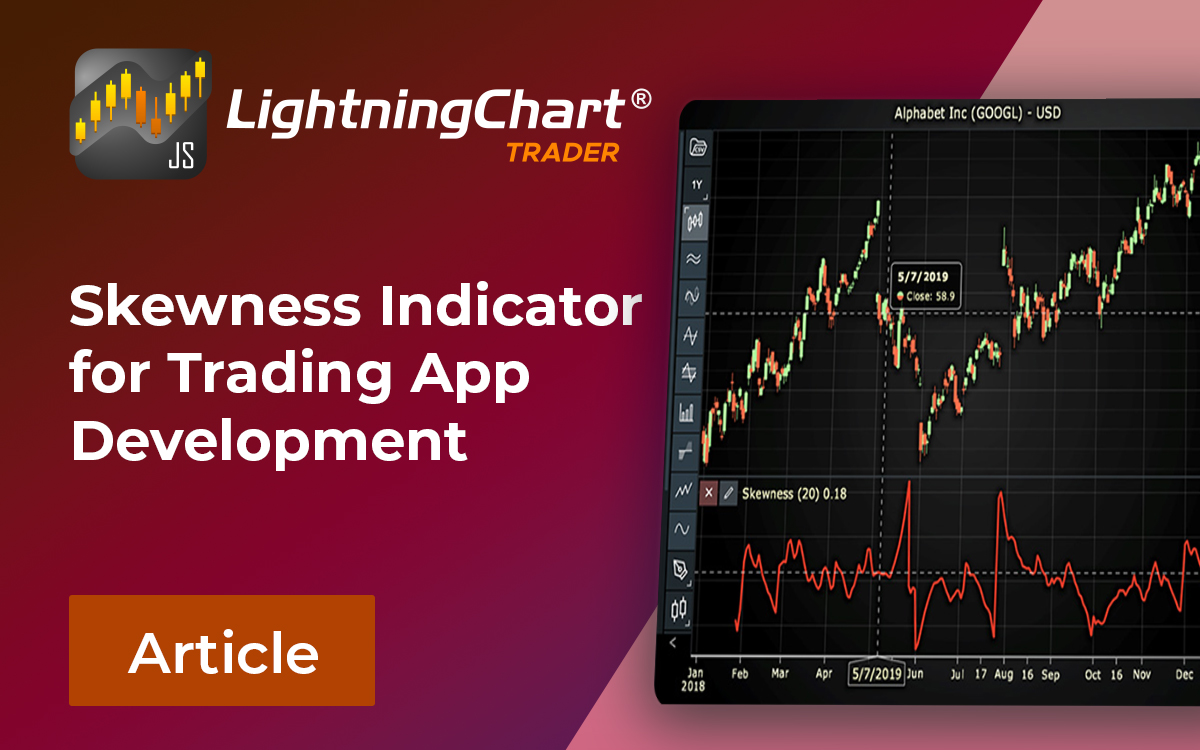
IntroductionThis article is a demonstration of the charting features included in LightningChart’s Python trader (PT)...
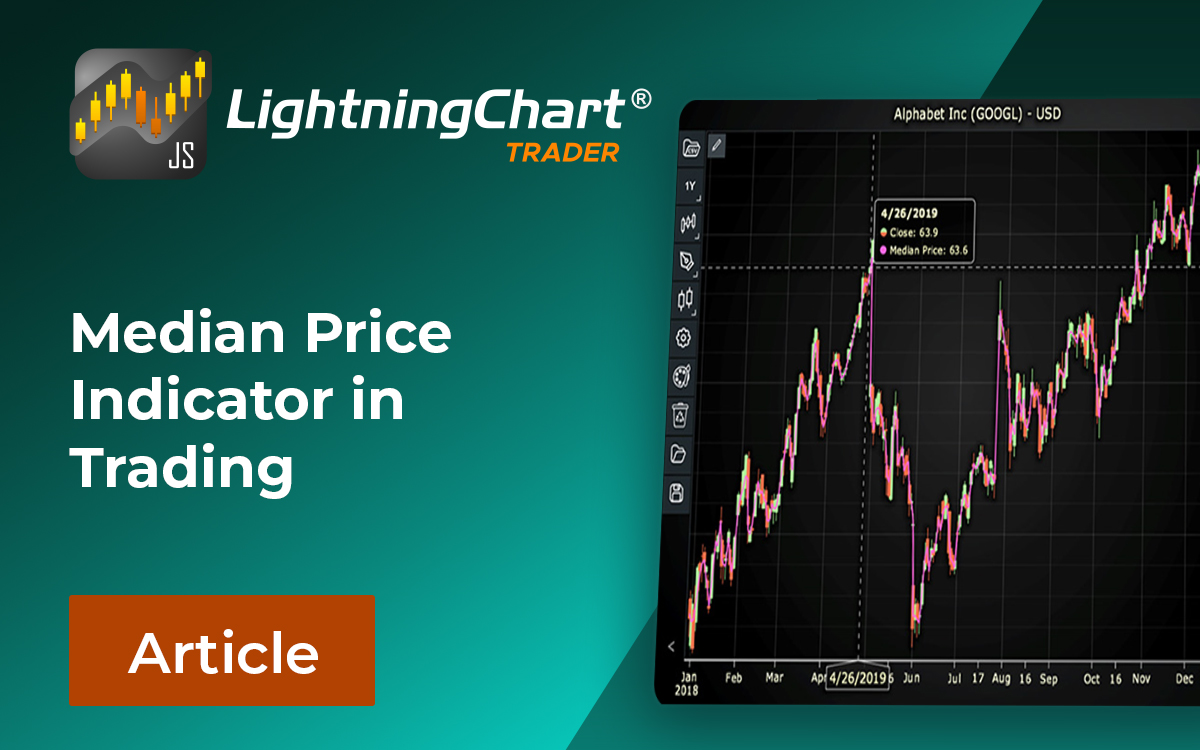
IntroductionThis article demonstrates how to perform basic stock analysis on the LightningChart Python trader. Charts...
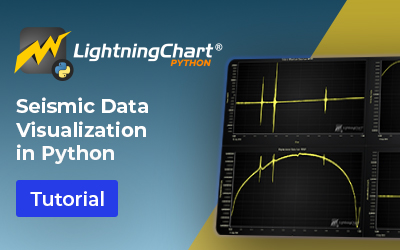
Written by a human | Updated on April 23rd, 2025Seismic Data Visualization Array Exercise in PythonThis project...

Written by a human | Updated on April 23rd, 2025Chronic Disease Visualization in PythonPredictive analytics nowadays...

Written by a human | Updated on April 23rd, 2025World Extreme Weather Analysis Application in PythonIn today's era of...

Written by a human | Updated on April 23rd, 2025Dashboard for Marine Seismic DataThis project demonstrates the use of...

Written by a human | Updated on April 23rd, 2025What is Structural Health Monitoring (SHM)?Structural Health...

Written by a human | Updated on April 23rd, 2025Stock Market Sentiment Analysis Python ApplicationStock market...
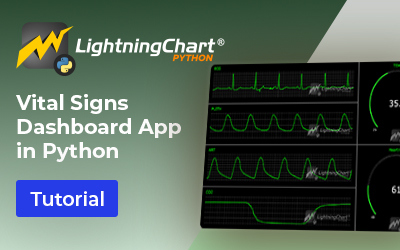
Written by a human | Updated on April 23rd, 2025Vital Signs Dashboard in Python with LightningChartVital signs are...

Written by a human | Updated on April 23rd, 2025Sea Level Visualization in PythonOver the past 50 years, global sea...

Written by a human | Updated on April 23rd, 2025Marine Seismic Time-Series Analysis with LightningChart PythonMarine...