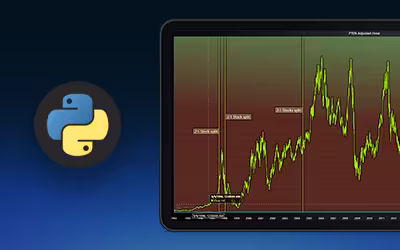
IntroductionThis article demonstrates a market data analytics approach to Patterson-UTI Energy (PTEN) stock price,...


Regional Account & Marketing Executive (China, Japan and South Korea)
+358 503 543 706
Book a meeting
Regional Account Manager (North America, South America)
+358 505 528 995
Book a meetingOur dedicated sales team is ready to help you find the perfect solution for your data visualization needs. Don't hesitate to reach out for personalized assistance or to schedule a demo of our products.

Regional Account & Marketing Executive (China, Japan and South Korea)
+358 503 543 706
Book a meetingRegional Account Manager (North America, South America)
+358 505 528 995
Book a meetingOur dedicated sales team is ready to help you find the perfect solution for your data visualization needs. Don't hesitate to reach out for personalized assistance or to schedule a demo of our products.


IntroductionThis article demonstrates a market data analytics approach to Patterson-UTI Energy (PTEN) stock price,...
IntroductionThis article is a short demonstration of LightningChart Python’s charting features. The library will be...

IntroductionThis article is a demonstration of the charting features included in LightningChart’s Python trader (PT)...
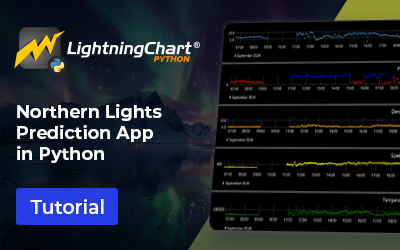
Written by a human | Updated on April 24th, 2025Northern Lights Prediction in PythonSolar flares originate from...

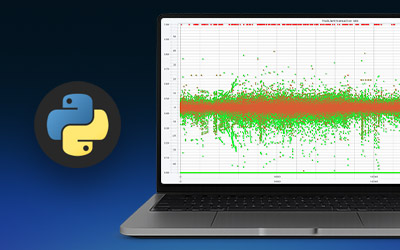
Written by a human | Updated on April 24th, 2025SONAR Object DetectionSonar (Sound Navigation and Ranging) is a...
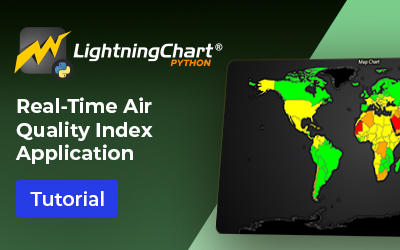
Written by a human | Updated on April 24th, 2025Air Quality Index Python ApplicationAir Quality Index (AQI) is a key...

Written by a human | Updated on April 23rd, 2025Tables in WPFIn this exercise, we'll create a chart with data...

Written by a human | Updated on April 23rd, 2025WPF Scatter ChartIn this article, we'll explore working with Lightning...

Written by a human | Updated on April 23rd, 2025WPF Box Plot ChartIn this article, we'll walk through a quick and easy...

Written by a human | Updated on April 23rd, 2025Global Earth Temperatures AnalysisThe global temperature has been a...

Written by a human | Updated on January 13th, 2026JavaScript Lasso Selection ToolIn this article, we will create a...

Written by a human | Updated on April 23rd, 2025Custom Annotations JavaScript ChartsLightning Chart JS allows the...