IntroductionThis article demonstrates how to create the Nvidia stock analysis using LightningChart Python Trader as a...


Regional Account & Marketing Executive (China, Japan and South Korea)
+358 503 543 706
Book a meeting
Regional Account Manager (North America, South America)
+358 505 528 995
Book a meetingOur dedicated sales team is ready to help you find the perfect solution for your data visualization needs. Don't hesitate to reach out for personalized assistance or to schedule a demo of our products.

Regional Account & Marketing Executive (China, Japan and South Korea)
+358 503 543 706
Book a meetingRegional Account Manager (North America, South America)
+358 505 528 995
Book a meetingOur dedicated sales team is ready to help you find the perfect solution for your data visualization needs. Don't hesitate to reach out for personalized assistance or to schedule a demo of our products.


IntroductionThis article demonstrates how to create the Nvidia stock analysis using LightningChart Python Trader as a...
IntroductionIn this article, I’ll guide you through how to create a Google stock analysis using the Python Fintech...
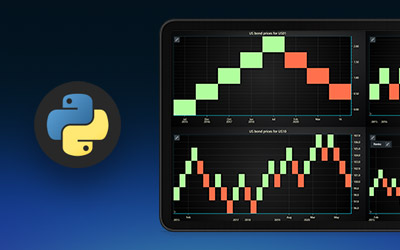
IntroductionThis article is a data visualization demonstration on how to create a bond yield analysis using...
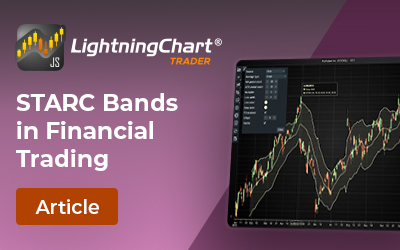
Written by a human | Updated on April 24th, 2025Introduction to STARC BandsSTARC Bands, or Stoller Average Range...
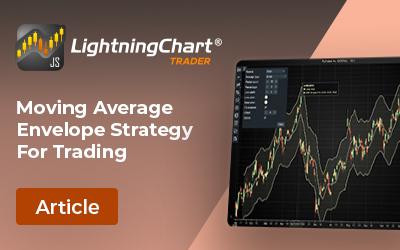
Written by a human | Updated on April 24th, 2025The Moving Average Envelope Strategy for Financial TradingThe Moving...
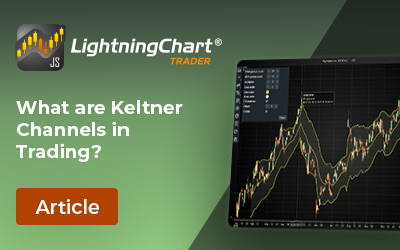
Written by a human | Updated on April 24th, 2025What Are Keltner Channels?Keltner Channels serve as a valuable tool...
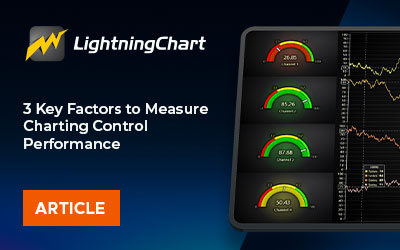
Written by a human | Updated on April 24th, 2025Introduction to Charting Control PerformanceIn the world of data...
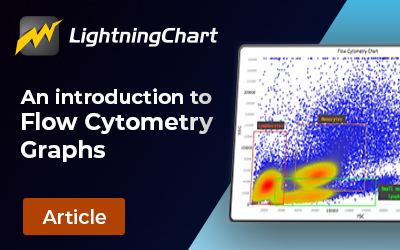
Written by a human | Updated on April 24th, 2025Introduction to Flow Cytometry GraphsFlow cytometry is a powerful...
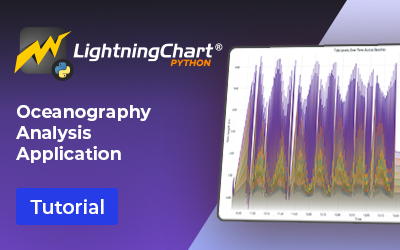
Written by a human | Updated on April 24th, 2025Oceanography Analysis Data ApplicationOceanography, the study of...
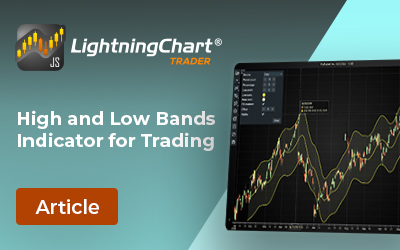
Written by a human | Updated on April 24th, 2025Introduction to High Low Bands IndicatorsIn the world of financial...
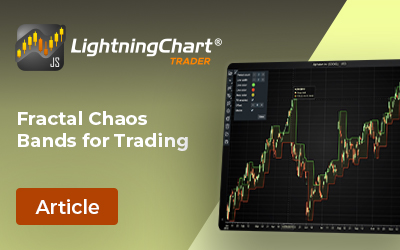
Written by a human | Updated on April 24th, 2025Introduction to Fractal Chaos Bands IndicatorsIn the fast-paced world...
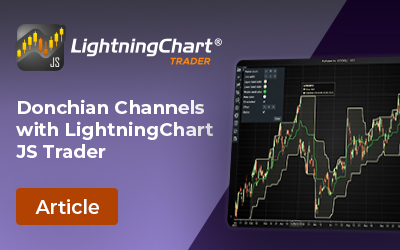
Written by a human | Updated on April 24th, 2025Introduction to Donchian ChannelsThe world of trading continues to...