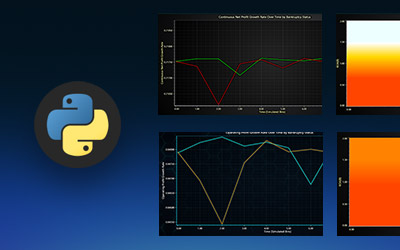
IntroductionThis project delivers a comprehensive financial visualization analysis using the Taiwanese Bankruptcy...


Regional Account & Marketing Executive (China, Japan and South Korea)
+358 503 543 706
Book a meeting
Regional Account Manager (North America, South America)
+358 505 528 995
Book a meetingOur dedicated sales team is ready to help you find the perfect solution for your data visualization needs. Don't hesitate to reach out for personalized assistance or to schedule a demo of our products.

Regional Account & Marketing Executive (China, Japan and South Korea)
+358 503 543 706
Book a meetingRegional Account Manager (North America, South America)
+358 505 528 995
Book a meetingOur dedicated sales team is ready to help you find the perfect solution for your data visualization needs. Don't hesitate to reach out for personalized assistance or to schedule a demo of our products.
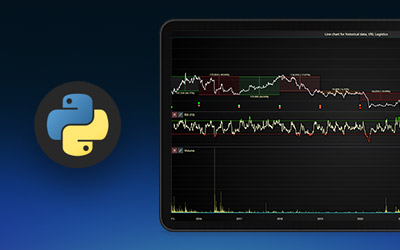
IntroductionThis project delivers a comprehensive financial visualization analysis using the Taiwanese Bankruptcy...
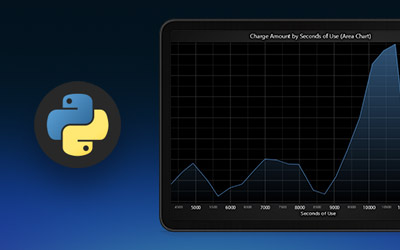
IntroductionThis project presents a comprehensive data visualization study on telecom churn analytics of customer...
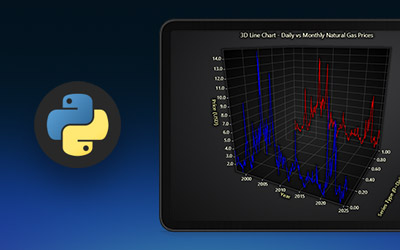
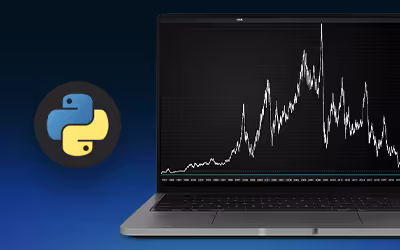
IntroductionThis project presents an analytical and visual exploration of global natural gas price trends using the...
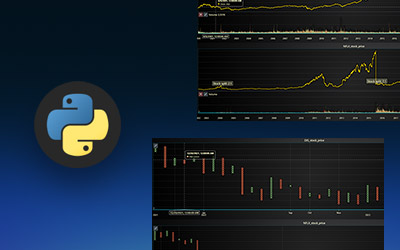
Introduction to Trade Volume Index IndicatorThe Trade Volume Index (TVI) is a pivotal technical indicator in the...
Introduction to Volume Technical IndicatorThe volume technical indicator is a fundamental tool in technical analysis,...
Introduction to Price Volume Trend IndicatorThe Price Volume Trend Indicator (PVT) is a technical analysis tool used...
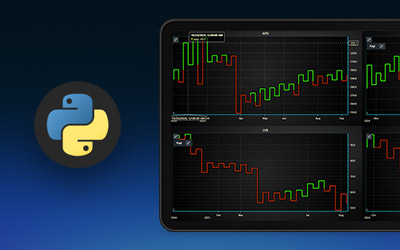
Introduction to Money Flow Index IndicatorThe Money Flow Index (MFI) is a widely-used technical indicator in stock...
What is the On-Balance Volume Indicator?On-Balance Volume (OBV) is a powerful technical analysis tool developed by...
What is the Positive Volume Index Indicator?The Positive Volume Index (PVI) is a technical indicator that tracks the...
Introduction to Negative Volume Index IndicatorThe Negative Volume Index (NVI) is a technical indicator that provides...
Introduction to EEG Frequency AnalysisElectroencephalography (EEG) is a powerful neuroimaging technique that captures...
Introduction to Market Facilitation Index IndicatorThe Market Facilitation Index (MFI), created by Bill Williams, is a...