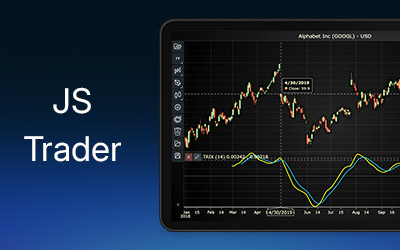
IntroductionThe Triple Exponential Average (TRIX) is a powerful momentum indicator used by traders to identify market...


Regional Account & Marketing Executive (China, Japan and South Korea)
+358 503 543 706
Book a meeting
Regional Account Manager (North America, South America)
+358 505 528 995
Book a meetingOur dedicated sales team is ready to help you find the perfect solution for your data visualization needs. Don't hesitate to reach out for personalized assistance or to schedule a demo of our products.

Regional Account & Marketing Executive (China, Japan and South Korea)
+358 503 543 706
Book a meetingRegional Account Manager (North America, South America)
+358 505 528 995
Book a meetingOur dedicated sales team is ready to help you find the perfect solution for your data visualization needs. Don't hesitate to reach out for personalized assistance or to schedule a demo of our products.
IntroductionThe Triple Exponential Average (TRIX) is a powerful momentum indicator used by traders to identify market...
IntroductionThe System Quality Number (SQN) is a technical indicator designed to evaluate the performance and...
IntroductionWe’re back with a LightningChart .NET tutorial: how to create a 3D waterfall chart in WPF. This example is...

Introduction to Percentage Price OscillatorThe Percentage Price Oscillator (PPO) is a popular technical indicator used...

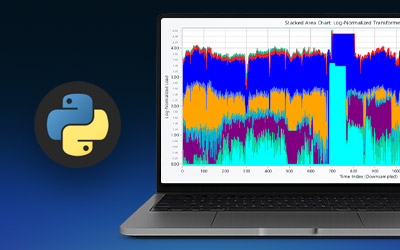
Python GUI Application Tutorial of a Real-Time Audio Data VisualizationDeveloping a desktop application for real-time...

Introduction to Moving Average Convergence DivergenceThe Moving Average Convergence Divergence (MACD) indicator is a...

Introduction to injuries in sports data analysisSports injuries represent one of the most common and challenging...
What is the Momentum Oscillator Indicator?The Momentum Oscillator is a pivotal tool in technical analysis, offering...
What is the Intraday Momentum Index Indicator?The Intraday Momentum Index (IMI) is a powerful technical analysis tool...

Introduction to Fractal Chaos OscillatorThe Fractal Chaos Oscillator (FCO) is a technical indicator that measures...
What is the Elder's Market Thermometer Indicator?The Elder's Market Thermometer is a technical indicator designed to...
What is the Elder-Ray Index Indicator?The Elder-Ray Index is a popular technical indicator used by traders to evaluate...