Industry of business: Optics and Photonics
Established: 1991
Website: www.zemax.com
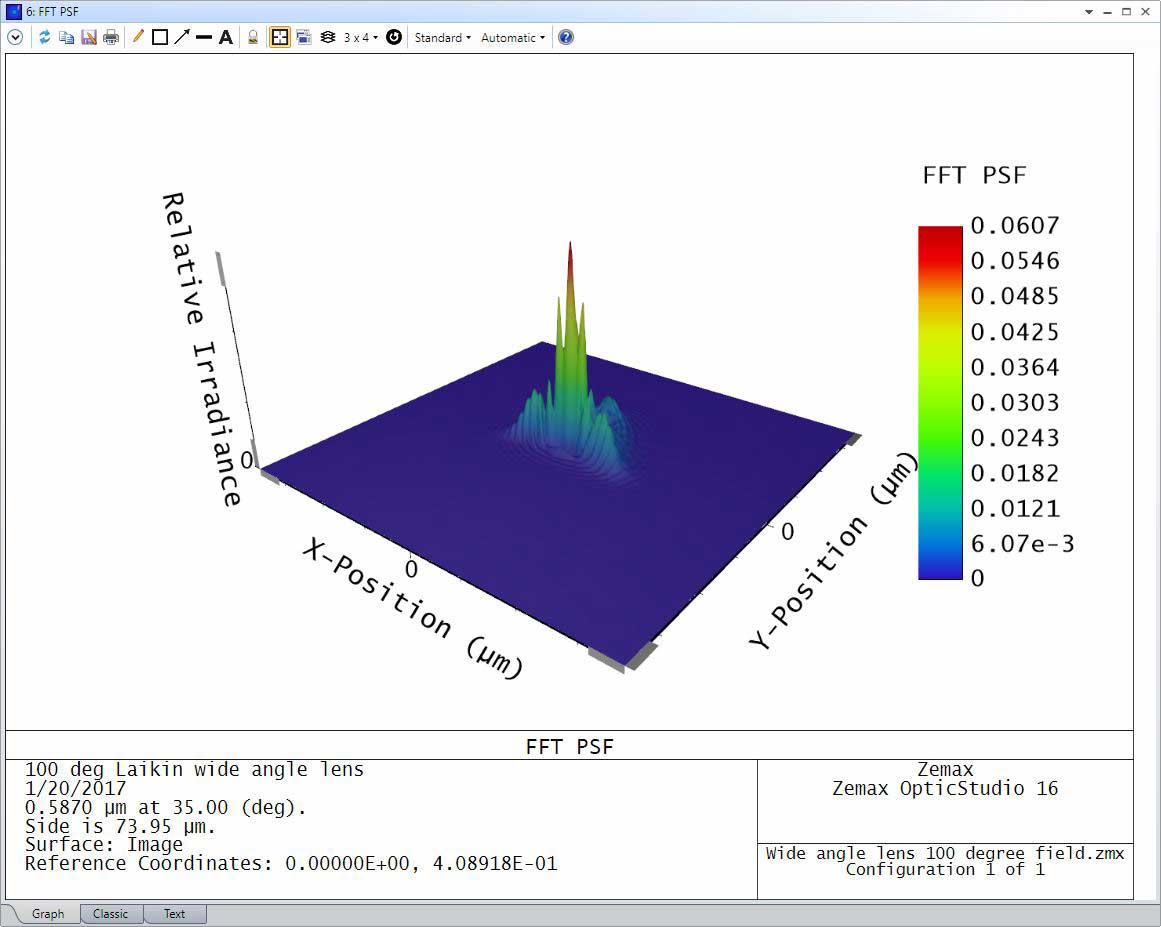
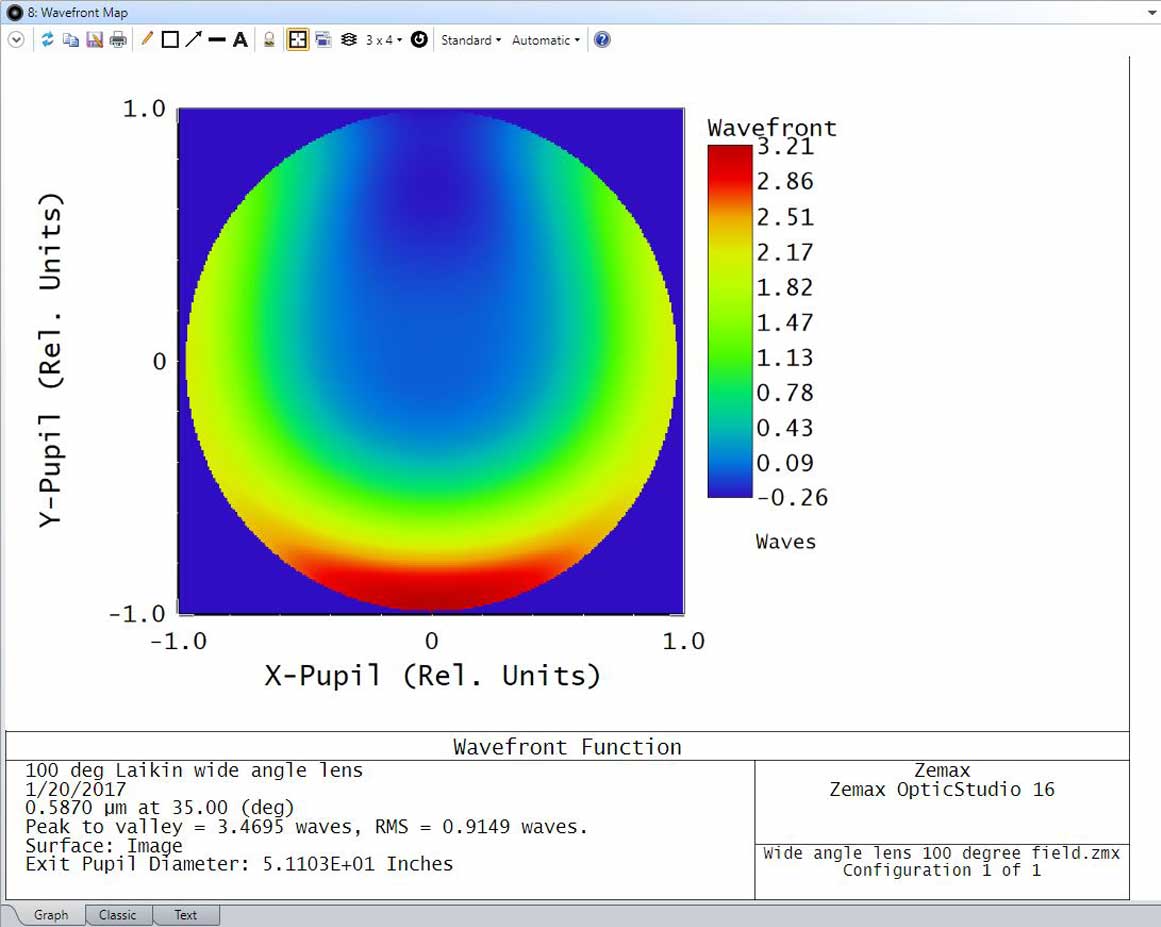
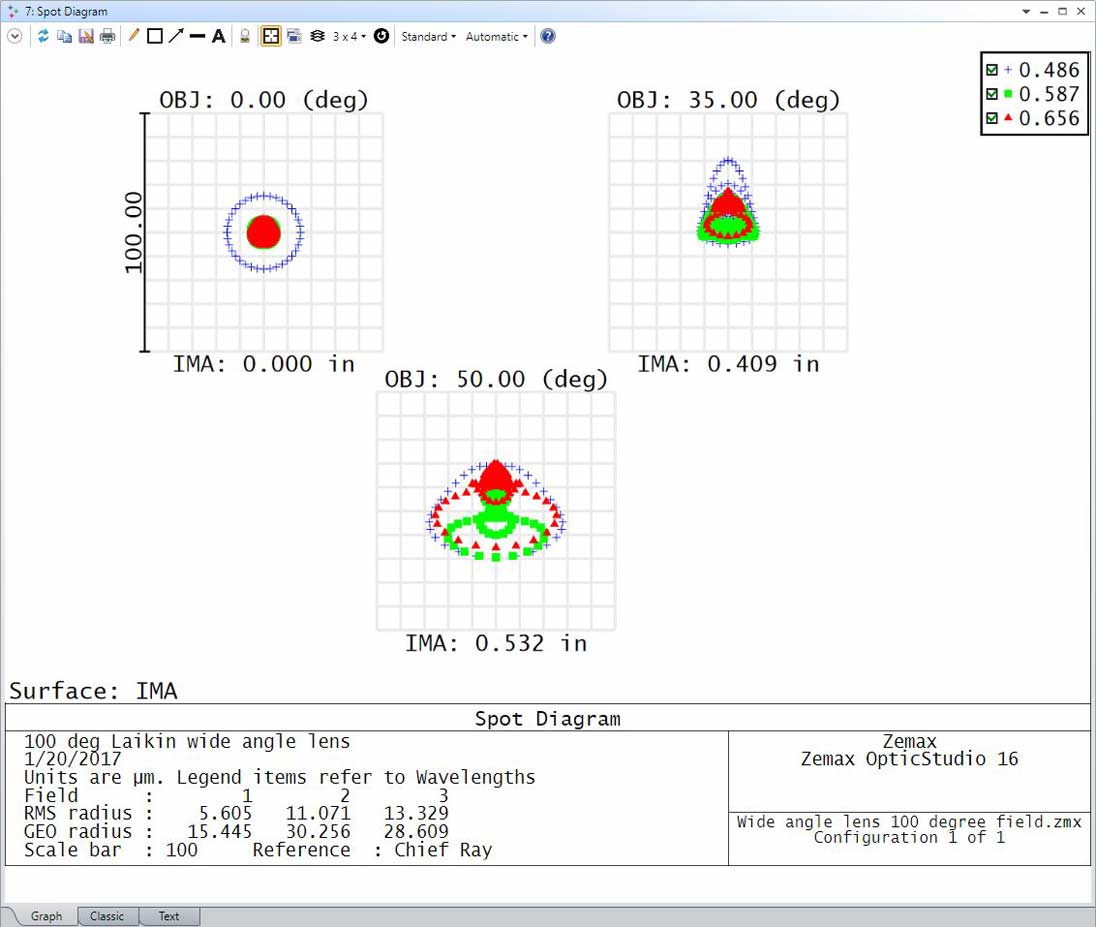
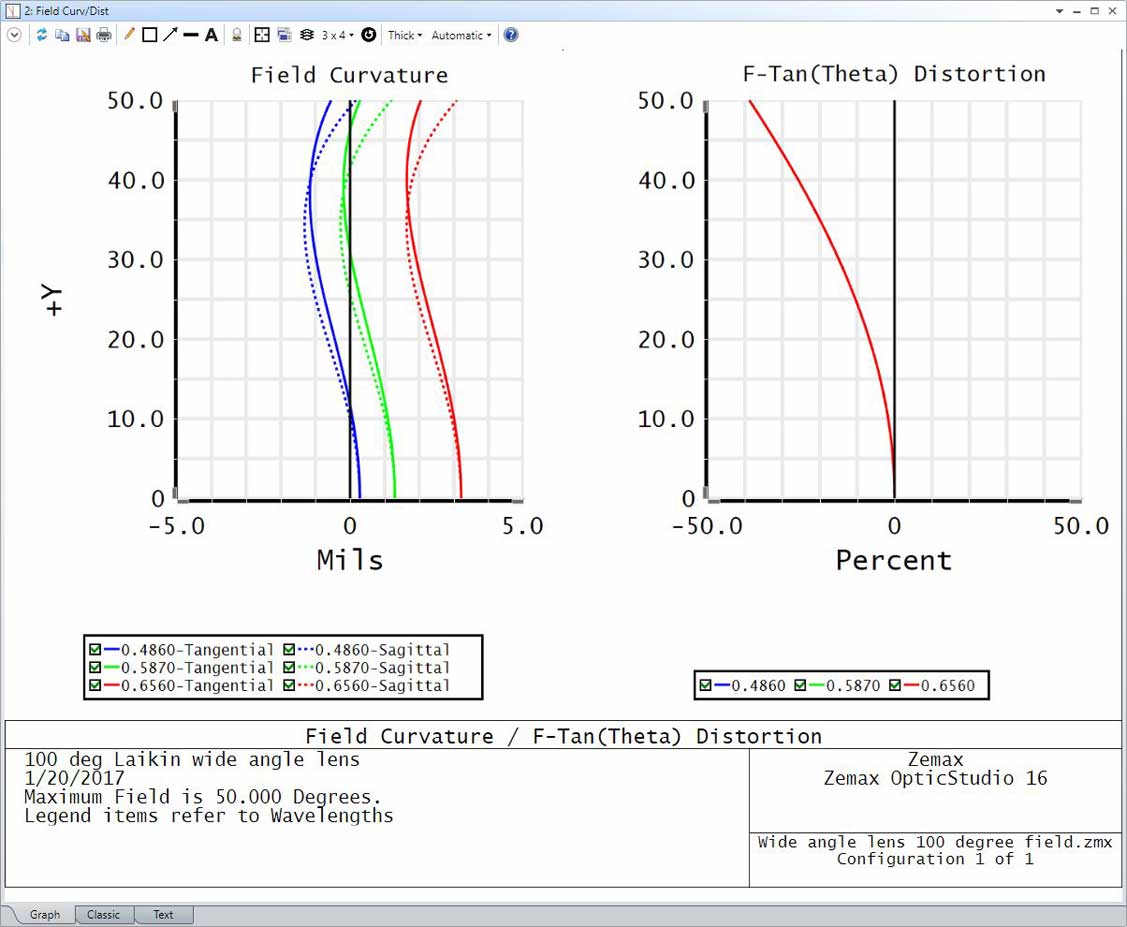
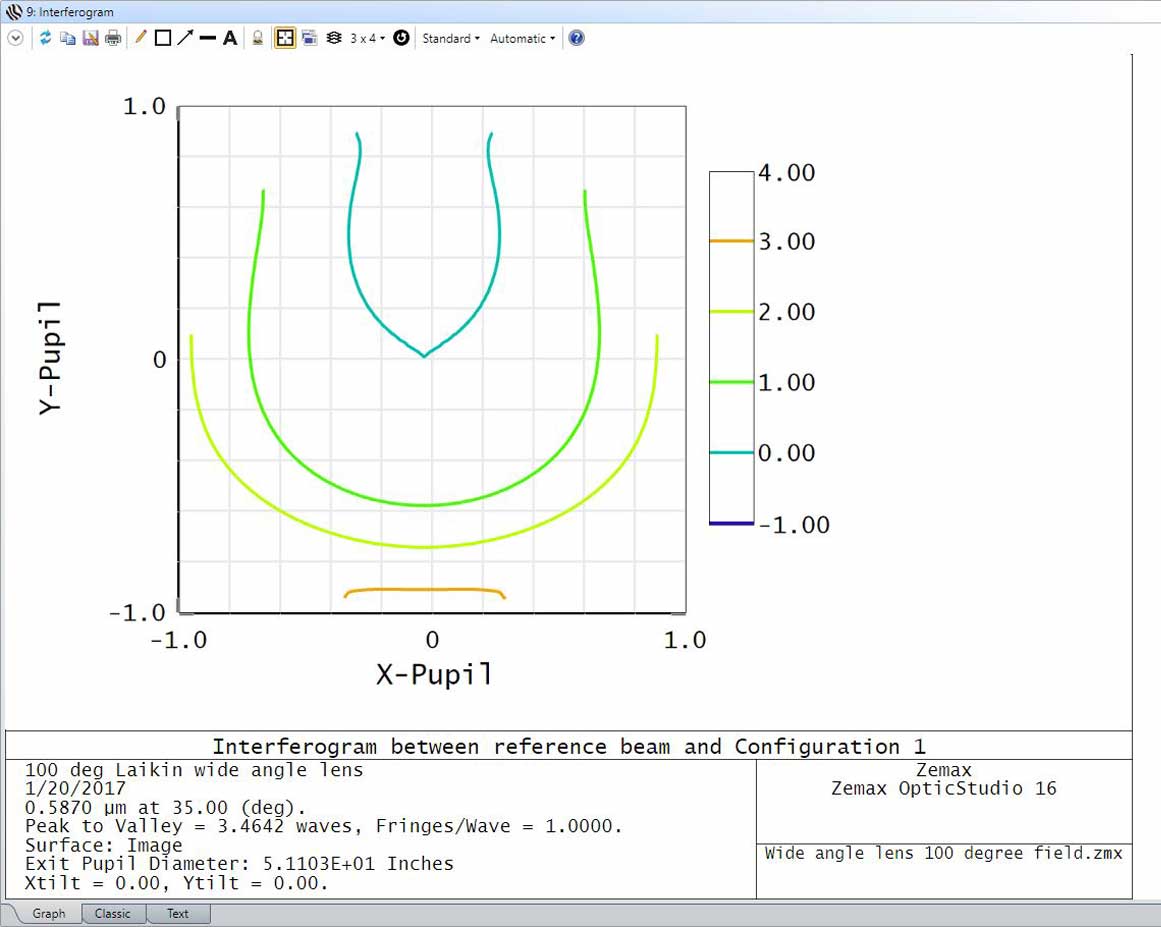
LightningChart solution: XY plots, intensity grids, contours, 3D surfaces
CULTURE OF EXCELLENCE AND INNOVATION
Zemax help scientists, engineers, researchers and students turn their optical and illumination systems ideas into reality. Rock-solid physics architecture, a culture of excellence and innovation, and responsiveness to customers are the cornerstones of their company. Their product OpticStudio™ is a software platform for optical engineers, researchers and scientists that supports the end-to-end design process.
VERY INTUITIVE DATA FLOW AND EVENT HANDLING
Senior Computational Physicist Shawn C. Gay from Zemax appreciates LightningChart performance capabilities. “We chose LightningChart, because it’s the most powerful WPF charting library on the market.” He also highlights that one of the best features of LightningChart is its very intuitive data flow and event handling.
Mr. Gay thanked LightningChart team for giving exceptional support. “The technical support is great. We have submitted numerous comments and improvement suggestions and the response is usually within 24 hours and bug fixes are turned around often in a few days.” He aligns with many other LightningChart customers when stating his opinion: “The LightningChart customer support is always great.”
EFFORT PUT IN PRODUCT DEVELOPMENT HAS GIVEN BIG PAYOFF
“LightningChart have helped us bring a more interactive style of chart to our application. For large data sets, LightningChart’s chart library has proven to be very efficient.”
