



Student Case Study: Temperature Line chart in C# with LightningChart
The need I had for the project was to find a charting control to plot real-time temperature data. I tried many controls, including those which were recommended to me on different forums. However, after I tried them all, the result was still not good. Therefore, I continued searching, and I found the perfect charting control – LightningChart.
I would like to share the process of how to draw an ideal temperature line chart by using LightningChart.
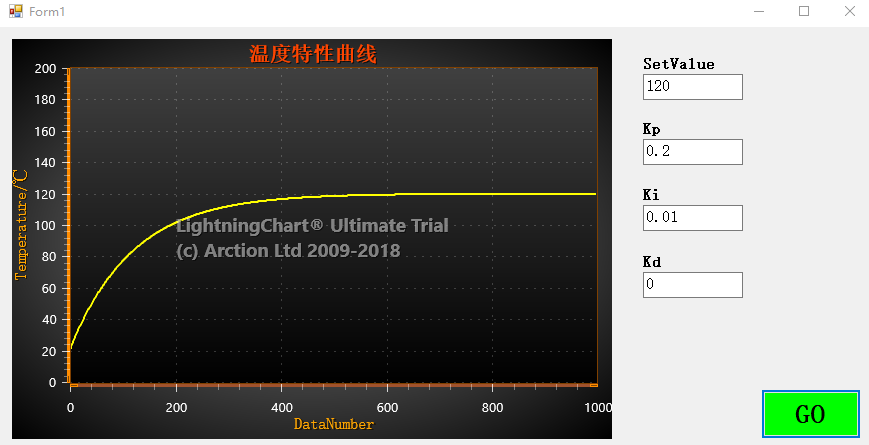
Firstly, I would like to show the final chart rendering, so you can see immediately if this kind of chart is suitable for your project or not.

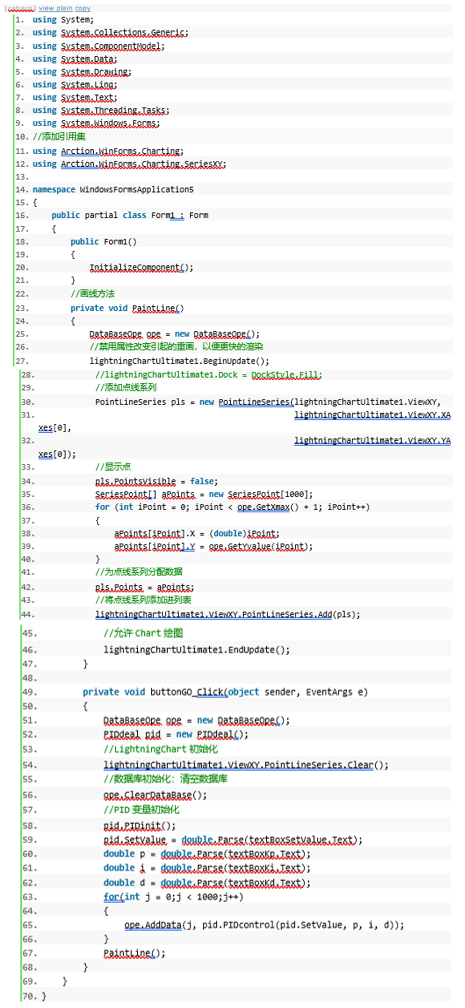
In addition to the simple function I used, LightningChart also has many other powerful features, for example:
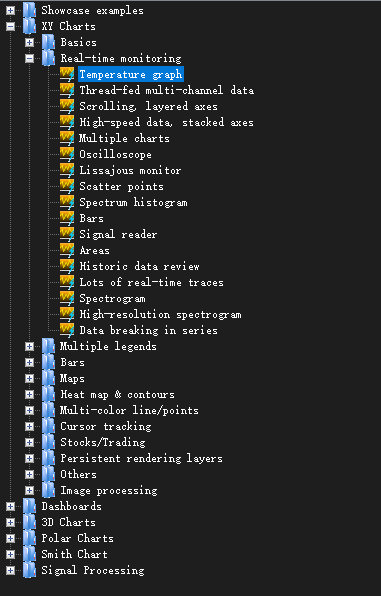
Still, the information about such a powerful .NET component was not so easy to find on the internet. I am a university student and spent a lot of time searching for solutions for my school project. Luckily I found LightningChart, and I sincerely hope more professional developers can use this component and share more coding experience with the students like me.
Author: Pengkun Zhao, student at Northeastern University in China.



If you have any questions, feel free to contact us!
©LightningChart Ltd 2025. All rights reserved.





