


A Biotech Stock Analysis with LightningChart Python Trader
Tutorial
Written by a Human
Conducting a biotech stock analysis using LightningChart Python Trader to analyze John & Johnson, Pfizer, and Merck and Company stocks.
Mikael Virtanen
Data Science Python Developer

Introduction
This article is a demonstration of the charting features included in LightningChart’s Python trader (PT) library. The library will be used to visualize the stock data of 3 different companies from the last 5 years. The companies in question are Merck & Company, Inc. (MRK), Johnson & Johnson (JNJ), and Pfizer, Inc. (PFE). The article explains how to retrieve the data from the API and import data to Python trader, as well as how to generate and customize charts in it. Additionally, a brief introduction to the data being analysed.
Regulations in the biotech & pharmaceutical industry
As the biotech industry deals with products that affect people’s health and well-being very directly, it has numerous regulatory bodies monitoring the companies involved, as well as numerous standards that need to be followed. In the US, agencies regulating biotechnology include the Food and Drug Administration FDA, the U.S. Department of Agriculture USDA, Environmental Protection Agency EPA.
In the pharmaceutical industry, the main regulatory body is the FDA. FTC is an agency that is responsible for regulating the advertisement and marketing of nonprescription drugs; however, FTC’s scope is a lot larger than just the biotech/pharma industry.
In the EU, the European Medicines Agency (EMA) is the main body responsible for pharma and biotech regulations. European Commission (EC) grants the final approval to drugs recommended by the EMA and issues a legally binding marketing authorization valid in all 27 EU member states.
Regulation changes
In the past 5 years, several regulatory changes have been implemented that affect the discussed industries. These include the FDA Modernization Act 2.0 (2022). The purpose of this act was to reduce animal testing by allowing alternative methods (cell-based assays, computer models, organ-on-chip systems).
Accelerated Review Innovations (2024–2025, pilot program), an act aiming to reduce drug approval time via AI. The FDA would utilize real-time reviews to submission, and have an AI go over them. The directive EU Clinical Trials Regulation aims to harmonize rules concerning clinical trials across EU member states.
Notable events
Most industries were affected by covid-10 to some degree, some more than others. Biotech and pharma were in a particularly special position as they could benefit from the pandemic. Companies such as Johnson & Johnson, Pfizer, and Moderna were manufacturing vaccines used to fight the COVID-19 virus; of these, J&J’s was deemed to be risky, and its distribution was discontinued.
In 2021, new oral antivirals and monoclonal antibodies were developed. The first in-body genome-editing treatment based on the CRISPR technology was approved by the FDA in 2023. Pfizer acquired Seagen to bolster its oncology pipeline with antibody-drug conjugates in 2023.
The API – Alpha Vantage
The Alpha Vantage API provides free access to most of its APIs with a limit of 25 API calls per day. This includes data on stocks, options, forex, and crypto from several exchanges, with historical data covering the last 20 years. Both adjusted and unadjusted data are available in their stock API. This demonstration will focus on their commodities API exclusively.
There is a 15-minute delay in the stock data for the free and cheapest premium subscriptions, thus putting one at a disadvantage if wanting visualize data in real-time. Additionally, the limit of 25 calls per day can be problematic when testing the functionality of the API. The premium subscriptions start at $50 / month (75 API calls per minute).
Plotted variables
Python trader requires Open, High, Low, Close (O, H, L, C) values to work (as well as a date). The API returns of all these.
API parameters
Not all of these are available for all of the series, and available values also vary.
‘function’ = name of the data series of choice. For example, “REAL_GDP”.
‘interval’ = time interval between data points. Not available for all series. Available options also vary between series. Consult Alphavantage’s documentation for detailed options.
‘datatype’ = In what form the data is given. JSON and CSV are available. Optional defaults to JSON.
‘apikey’ = your api key. Either the free or the premium license.
LightningChart Python Trader
LightningChart’s Python Trader (PT) provides extensive charting solutions with a high degree of customizability through its easy-to-use UI and built-in functionalities. Since the library is built for Python, it’s also possible to use other Python libraries if necessary.
As with all Lightningchart products, Performance has been a high priority when developing the library, even when working with large amounts of data, thus removing possible bottlenecks in this area.
Overview of the UI

Above is the PT user interface with stock data charted using the default candlestick chart. On the top left are controls used to customize the chart and work with datasets. Here is the explanation for all the UI controls:

Charting features
These are chart types of Python trader provides out of the box.

Chart types can be changed with the the UI or with the set_price_chart_type(chart_type) command. Available ones are ‘CandleStick’, ‘Bar’, ‘Line’, ‘Mountain’, ‘HeikinAshi’, ‘Renko’, ‘Kagi’, and ‘PointAndFigure’. For example, a mountain creating a mountain chart using the following methods:
trader.set_price_chart_type('Mountain')
trader.add_data_array(data)
trader.open()
Chart visuals can be customized using the Python trader UI. Below are available settings for chart and indicator colours, background colour/image etc.


Default chart colours.

Background and indicator colours changed

Chart customization
Customisation can also be done with code, using the built-in methods. The code below changes the background image and the chart colours to the ones seen in the right image. But why use code for customisation, since working with UI is easier?
trader.set_color_theme('cyberSpace')
# Changing the indicator colours for the candlesticks
trader.set_positive_body_color('#0fdf0c')
trader.set_positive_wick_color('#33d7a0')
trader.set_negative_body_color("#f3eb16")
trader.set_negative_wick_color('#b85900')
When the customization is applied on code level there’s no need to change any settings or load a template. Meaning you won’t have to make the changes every time when opening a chart. Python trader supports the use of templates for customization, and these files can be loaded in with code.
However, you still need to manually select the file, and in case you want to share the chart the template file would also need to be shared. When the changes are done in code, only it needs to be shared to get the same results.
Technical indicators
Python trader supports over 100 technical indicators. These include ones such as Relative Strength Index (RSI), Bollinger bands, Moving averages (SMA, EMA etc), Oscillators for money flow and price, Fibonacci retracements, as well as statistical ones like Standard deviation. Technical indicators can be added to a chart easily with the trader UI, their properties (period count, standard dev) can also be changed the same way.

These indicators can also be added and customized via code.
trader.add_simple_moving_average(period_count=14)
trader.add_bollinger_band(period_count=14)
Indicators such as the Fibonacci patterns can be added with the built-in draw tools. Other markers can also be added this way. To see all the indicators, refer to the documentation.

Setting Up Python Environment
The logic and variables are the same for all charts. Only the ‘ticker’ variable needs to be adjusted between them. Value of 0-,2 depending on what company is being charted. You can find more information regarding the API parameters from Alphavantage’s documentation. Although they don’t need to be changed for this project’s scope. For more information, consult Alpha Vantage’s documentation.
import requests
from lightningchart_trader import TAChart
license_key_path = "Python-Trader_License_key.txt"
# Load the license key and initializing Python trader
license_key = open(license_key_path).read()
trader = TAChart(license_key)
# api_name is the APi you wish to use for data eg: TIME_SERIES_DAILY. 'ticker' is the ticker specific stock eg: AAPL
# key is your Alphavantage API key
# https://www.alphavantage.co/query?function=api_name&symbol=ticker&apikey=key
api_key_path = "API-key.txt"
# Load the license key
api_key = open(api_key_path).read()

# Parameters used in Alphavantages API, consult their documentation for more details. Only 'ticker' needs to be adjusted for this projects scope.
ticker_list = ['JNJ', 'PFE', 'MRK']

api_name = 'TIME_SERIES_DAILY_ADJUSTED'
outputsize = 'full'
ticker = ticker_list[2]
# API URL change the ticker_list[x] index to whichever company you want tot chart
template_url = f'https://www.alphavantage.co/query?function={api_name}&apikey={api_key}&outputsize={outputsize}&symbol={ticker}'
API function
def api_call(template_url):
    """Make an API call for every URL passed to the function and convert the JSON respond to a Python dictionary"""

    request = requests.get(template_url)
    request_dict = request.json()
    data_key = list(request_dict.keys())
    # Formatting the API data for the Trader chart.
    data_list = []
    for date, value in request_dict[data_key[1]].items():
        o = float(value['1. open'])
        h = float(value['2. high'])
        l = float(value['3. low'])
        c = float(value['4. close'])
        v = float(value['6. volume'])
        # Data needs to be in this order for the trader to work. Open,High,Low,Close,Volume(optional),Date.
        # Dictionaries returned by the API use date as the dictionary key
        data_list.append({'open': float(value['1. open']),
                          'high': float(value['2. high']),
                          'low': float(value['3. low']),
                          'close': float(value['4. close']),
                          'volume': float(value['6. volume']),
                          'date': date})

    # Adding the data to the chart and setting chart title to the ticker
    title_key = request_dict[data_key[0]]['2. Symbol']
    trader.set_data(data_list)
    trader.set_chart_title(title_key)
Call the api function and set other chart properties
api_call(template_url)
# Set chart customization and indicators
trader.add_simple_moving_average(period_count=5)
trader.add_moving_average_convergence_divergence()
trader.add_volume()
trader.add_relative_strength_index(period_count=5)
trader.change_time_range(2)
trader.open()
Biotech Stock Analysis
As explained in the introduction, the purpose of this article was to analyse the 5-year stock of 3 companies that operate in the biotech/pharma.
Johnson & Johnson
First of we have a chart for Johnson & Johnson, during the last 5 years, several notable events have happened. Such as creating a new ‘spin-off’ company consisting of their consumer health division in 2021. Their CEO changed in 2022 with Joaquín Duato stepping into the role. J&J experienced a setback with their COVID-19 vaccine as it was banned due to safety risks and lack of efficacy when compared to alternatives.
However, this didn’t affect its share price by much, as the margins on the shots were low in the first place, and it wasn’t a large portion of their operating income. In August, J&J experienced a major increase in trade volume. This was due to shareholders being able to swap their J&J stock into Kenvue’s (the consumer health spinoff company) stock.

Pfizer, Inc
In the past 5 years, Pfizer has, among other things, acquired several companies to expand its revenue streams, as pandemic-related product sales decreased. Between 2021 and 2023, Pfizer acquired companies such as Trillium Therapeutics, Arena Pharmaceuticals, ReViral, Biohaven, Global Blood Therapeutics, and Seagen. Pfizer launched a cost-cutting program intended to reduce the impact of declining COVID product revenue in 2024.

Merck & Company, Inc
Over the past 5 years, Merck & co too has acquired several companies. Some of these include VelosBio, Acceleron Pharma, Harpoon Therapeutics, and EyeBio. In March 2024, the FDA approved Winrevair (sotatercept) as the first activin signaling inhibitor for pulmonary arterial hypertension.
Merck announced an investment to build a new manufacturing facility in Delaware for Keytruda in 2024. Robert Davis replaced Kenneth Frazier as the CEO in July 2021. Frazier continued as an Executive Chairman.

Conclusion
It’s easy to make a conclusion based on the candlesticks and technical indicators. However, it’s of course important to remember that these do not tell the whole truth. Since events during the last five or so years have affected economies globally, it’s important to keep in mind macroeconomic factors.
This visualization gives a good demonstration of how relying only on charts is not a good idea. One should further investigate macro and microeconomic factors to get a deeper understanding of why something happens.
Continue learning with LightningChart
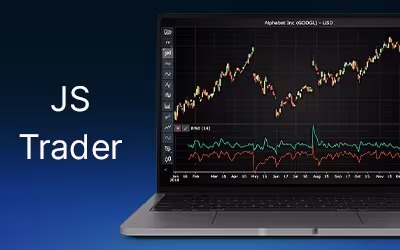
Random Walk Index Indicator for Fintech App Development
Discover how the Random Walk Index helps fintech apps detect true market trends, filter noise, and deliver smarter trading insights in real time.
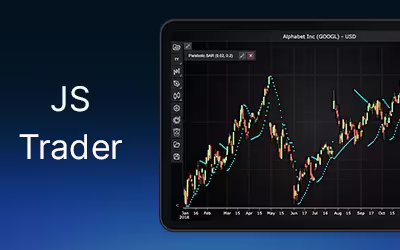
Creating a Parabolic Stop and Reverse Indicator for Fintech Applications
Build a Parabolic Stop and Reverse Indicator for fintech apps to detect trend direction, spot reversals, and improve trading strategy accuracy.
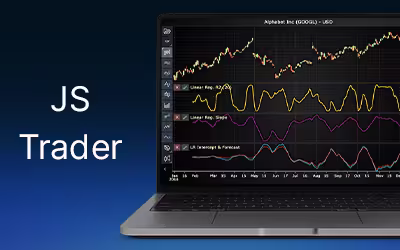
Linear Regression in Finance Application Development
Explore how linear regression in finance supports trend analysis, forecasting, and data modelling in application development with key metrics like slope and R².


If you have any questions, feel free to contact us!
©LightningChart Ltd 2025. All rights reserved.