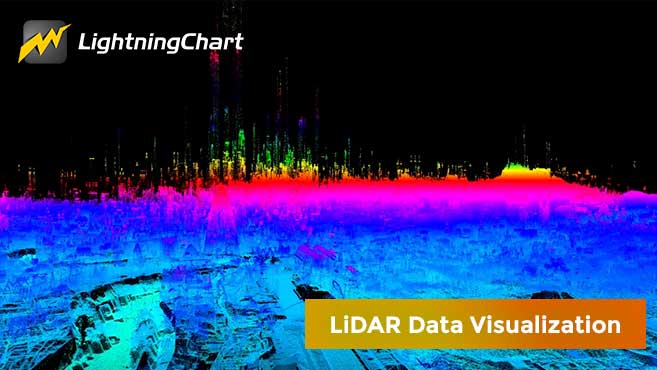
LightningChart .NETCreate a WPF 3D LiDAR Chart
TutorialLearn how to create a 3D WPF LiDAR chart to visualize 56 million data points
3D WPF LiDAR Chart
Hello!
In this article, we will create a 3D WPF LiDAR chart using LightningChart .NET library and topographic data from London.
About LiDAR charts, Lidar or Light Detection and Ranging (active laser scanning) is a remote sensing method used to examine a specific surface of the earth.
Also, LiDAR is the instrument that is responsible for scanning topographic surfaces.
To get started, download the project template to follow the tutorial, and let’s begin setting up our local project.
Download the project to follow the tutorial
Local Setup
For this LiDAR chart project, we need to take in count the following requirements to compile the project.
-
OS: 32-bit or 64-bit Windows Vista or later, Windows Server 2008 R2 or later.
-
DirectX: 9.0c (Shader model 3 and higher) or 11.0 compatible graphics adapter.
-
Visual Studio: 2010-2019 for development, not required for deployment.
-
Platform .NET Framework: installed version 4.0 or newer.
Now go to the next URL and click the download button: http://lightningchart.com/net-charts/

You will be redirected to a sign in form, from then on, the process is very simple to follow. So, after confirming your email, you will have access to your own LightningChart account.
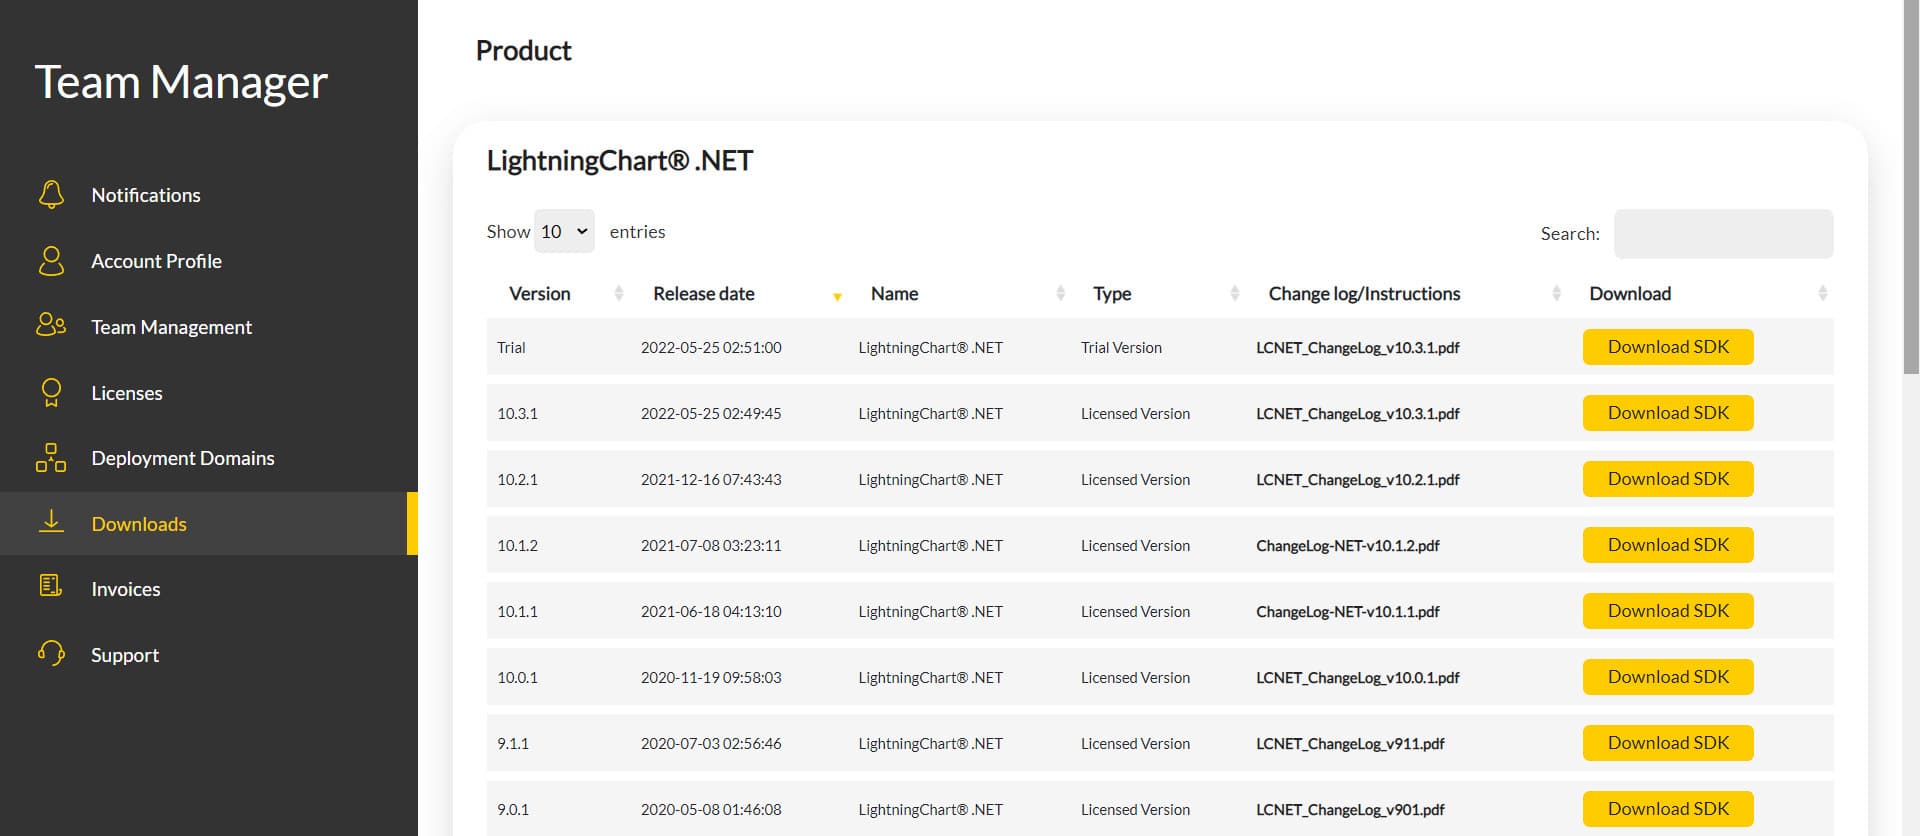
After you sign into your account, you will be able to download the SDK. This SDK will be a "free trial" version, but you will be able to use many important features.
If you download the SDK, you will have an .exe like this:

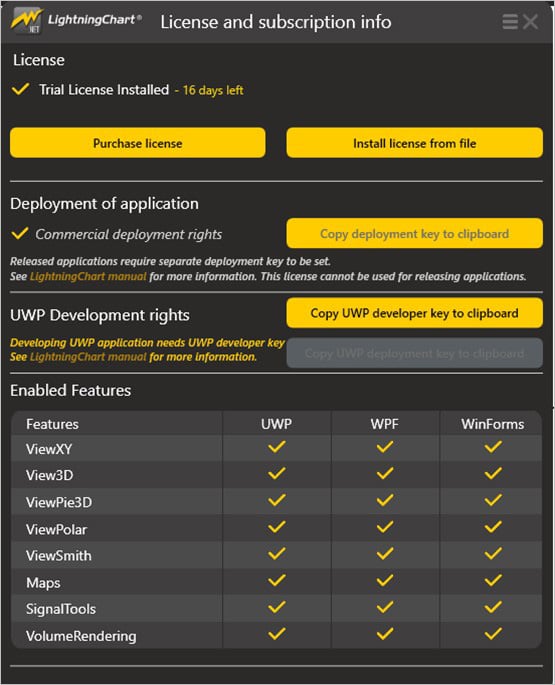
The installation will be a typical Windows process, so please continue with it until it is finished. After the installation, you will see the following programs:

- License Manager: In this application, you will see the purchase options. All the projects that you will create with this trial SDK, will be available for future developments with all features enabled.
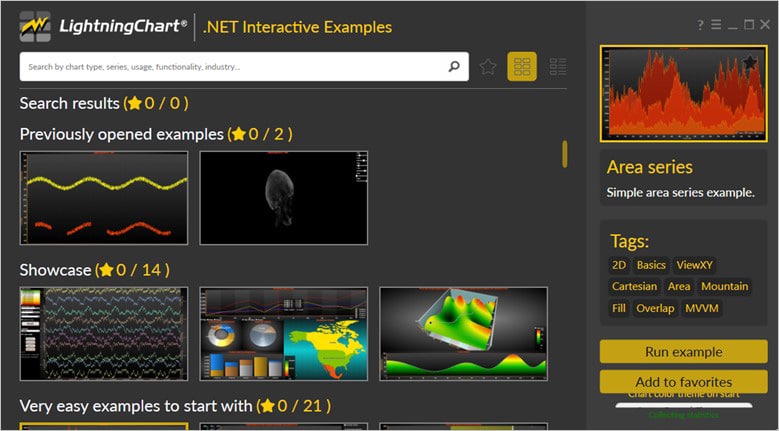
- LightningChart .NET Interactive Examples: now you can see 100+ interactive visualizations available for WPF, WinForms, and/or UWP though today we’re working with Smith Charts.
Visual Studio Project
Now let’s work with visual studio. The main difference between using the LightningChart .NET visualizer and Visual Studio, is that we will be able to analyze and experiment with many features in the source code. In the LC visualizer, select the Audio Output Signal Reader and run the example:

In the top-right zone of the windows, you will see the following options:
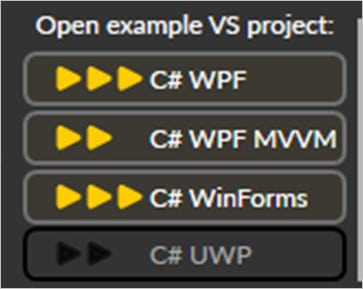
For trial SDK, we will be able to use the WPF and WinForms frameworks. If you are fully related to windows forms, this option will be more comfortable. In this case I will use the Windows Presentation Foundation framework.
After clicked the framework to use, we will need to specify a folder where the project will be created:

Finally, the project will be created, and the Visual Studio will be opened and ready for execution.
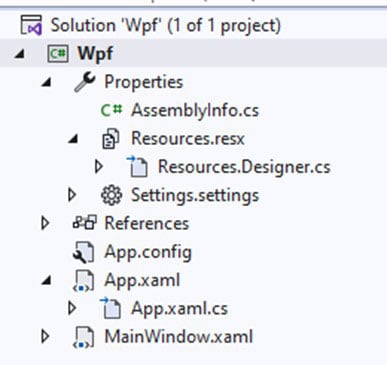
Code Review
The main code will be wrapped inside MainWindow.xaml.cs. Here we will find the code for UI controls.
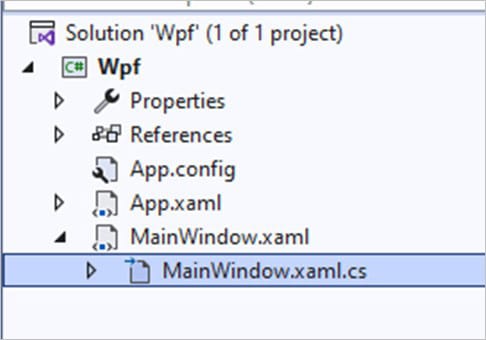
Inside the code we will check two methods that will create the properties that we need to draw correctly the chart.
CreateChart()
This main method will initialize many properties that are provided by the Lightning Chart .NET framework.
The great advantage here is, if you have C# knowledge, this syntax will be easier for you.
- _chart: The chart object will contain the LightningChart constructor… basically, this will contain a new instance of a chart object.
private LightningChart _chart;The Dispose function will clean up any resources that are being used.
if (_chart != null)
            {
                _chart.Dispose();
            }

            _chart = new LightningChart();
            _chart.ActiveView = ActiveView.View3D;
            _chart.View3D.WallOnBack.Visible = false;
            _chart.View3D.WallOnBottom.Visible = false;
            _chart.View3D.WallOnFront.Visible = false;
            _chart.View3D.WallOnLeft.Visible = false;
            _chart.View3D.WallOnRight.Visible = false;
            _chart.View3D.WallOnTop.Visible = false;
            _chart.View3D.XAxisPrimary3D.Visible = false;
            _chart.View3D.ZAxisPrimary3D.Visible = false;
            _chart.View3D.YAxisPrimary3D.Visible = false;
            _chart.View3D.LegendBox.Visible = false;
            _chart.Background = Brushes.Black;
            _chart.ChartBackground.Color = Colors.Black;
            _chart.ChartBackground.GradientFill = GradientFill.Solid;
            ChartGrid.Children.Add(_chart);
        }
Walls property, features:
- WallOnFront,
- WallOnBack,
- WallOnTop,
- WallOnBottom,
- WallOnLeft,
- WallOnRight)
These are used to add axis grids and gridstrips to the LiDAR chart. It also provides a base for the axes. The walls by default shows the bottom, left, right, back and front walls.
You can use the AutoHide property set to TRUE and when rotating the view, you’ll see the obstructing walls temporarily hidden. This is particularly useful to not block the view of the content within the LiDAR chart.
You can force a wall to be visible by setting setVisible = true and AutoHide = false.

Axes
There are two axes for each dimension: a primary and a secondary. Simply put, View3D has the following properties:
- XAxisPrimary3D,
- XAxisSecondary3D,
- YAxisPrimary3D,
- YAxisSecondary3D,
- ZAxisPrimary3D
- ZAxisSecondary3D
3D axes work similar to ViewXY axes. Many of the properties and methods are similar.
ChartGrid
The grid container of the LiDAR chart will be created with the ChartGrid object. To add the chart object to the grid, use the add function and send the _chart object as a value.
After initializing the chart object, we need to load the Lidar data files. LightningChart will store the ASC files in this path: C:\ProgramData\Arction\Lidar.
The directory will be sent to another CreateChart method. The following method will create the Lidar image with a Point Cloud visualization.
private void CreateChart(string _file)
        {
            try
            {
                //Get files in directory
                string[] files = Directory.GetFiles(_file);


                //Configure PointLineSeries 3D
                PointLineSeries3D _pls3d;
                _pls3d = new PointLineSeries3D();
                _pls3d.AllowUserInteraction = false;
                _pls3d.LineVisible = false;
                _pls3d.ShowInLegendBox = false;
                _pls3d.PointsType = PointsType3D.CompactPointsColor;
                _pls3d.PointStyle.ShapeType = ShapeType.Shape2D;
                _pls3d.PointStyle.Shape2D.Shape = Arction.Wpf.Charting.Shape.Triangle;
                _pls3d.PointsOptimization = PointsRenderOptimization3D.Pixels;
Configurating the PointLineSeries chart
The PointLineSeries3D enables to visualize points and lines within a 3D space. As for customizing the points, LightningChart .NET features several default 3D shapes. The points relate to the lines as long as the LineVisible property is enabled and set to TRUE.

LiDAR Chart Data
Now we need to read the LiDAR chart data and parse it to the PointLineSeries data.
for (int file = 0; file < (CBLoadOnlyOne.IsChecked == true ? 1 : files.Length); file++)
                {
                    SeriesPointCompactColored3D[] _SeriesPoints3D = new SeriesPointCompactColored3D[(data[file].Length - 6) * (data[file].Length - 6)];
                    string[] columns = data[file][1].Split(' ');
                    columnslenght = int.Parse(columns[1]);
                    string[] rows = data[file][1].Split(' ');
                    rowslenght = int.Parse(rows[1]);
                    string[] xllcorn = data[file][2].Split(' ');
                    string[] zllcorn = data[file][3].Split(' ');
                    string[] cellsize = data[file][4].Split(' ');
                    string[] NODATA_value = data[file][5].Split(' ');
                    double emptyspace = double.Parse(NODATA_value[1], provider);
                    int xStart = int.Parse(xllcorn[4]);
                    int zStart = int.Parse(zllcorn[4]);
                    float cells = float.Parse(cellsize[5], provider);
                    corners.Add((xStart, zStart));
The code above will load all the ASC files and extract the number of columns, rows, XCorner,YCorner, cellsize and NODATA values. If you open one ASC file, you will see a structure like this:

As you can see, the code is searching for each value by their horizontal indexes in the first column (0). At the end of the code, we are adding the corner values for X and Z axes. Those values will determine the limits of those Axes.
for (int i = 6; i < data[file].Length; i++)
                    {
                        string[] cols = data[file][i].Split(' ');
                        for (int x = 0; x < cols.Length; x++)
                        {
                            if (float.TryParse(cols[x], NumberStyles.Float, provider, out float yval))
                            {
                                if (yval != emptyspace)
                                {
                                    _SeriesPoints3D[(i - 6) * (data[file].Length - 6) + x].X = xStart + x * cells;
                                    _SeriesPoints3D[(i - 6) * (data[file].Length - 6) + x].Z = zStart + 1000 - i * cells;
                                    _SeriesPoints3D[(i - 6) * (data[file].Length - 6) + x].Y = yval;

                                    switch (_VariableWhatToDo)
                                    {
                                        case '*':
                                            _SeriesPoints3D[(i - 6) * (data[file].Length - 6) + x].Color = ChartTools.ColorToInt(ChartTools.ColorHSVA(_Startcolor + yval * _Multiplier, _Saturation, _Value, _Alpha));
                                            break;
                                        case '+':
                                            _SeriesPoints3D[(i - 6) * (data[file].Length - 6) + x].Color = ChartTools.ColorToInt(ChartTools.ColorHSVA(_Startcolor + yval + _Multiplier, _Saturation, _Value, _Alpha));
                                            break;
                                        case '-':
                                            _SeriesPoints3D[(i - 6) * (data[file].Length - 6) + x].Color = ChartTools.ColorToInt(ChartTools.ColorHSVA(_Startcolor + yval - _Multiplier, _Saturation, _Value, _Alpha));
                                            break;
                                    }
                                }
Now we must assign the X, Y, Z, and color values for each point series. The points will start from xStart and zStart values and for X axis, the position will be updated by adding the cells size plus the current column.
With that logic, the points will have enough spacing between themselves to create a 3D form. The i value starts in 6 because that index is where the coordinates are set. The yval will have the value of the current column(x) and the current row(i).
| 17.742 | 17.699 |
| 17.952 | 17.997 |
| 19.299 | 20.822 |
| 21.719 | 20.804 |
| 21.002 | 20.117 |
The _VariableWhatToDo corresponds to the combo box “what to do”, Depending on the selected option, we can apply different colors to the point series.
The values for the colors, will be assign by the UI controls, multiplier, Saturation, and alpha. The calculation tries to give a different color to each point, to make a best distinction of each point in the LiDAR chart.
_pls3d.IndividualPointColors = true;
                    _pls3d.AddPoints(_SeriesPoints3D, false);
If we set the IndividualPointColors property to TRUE, this will allow different colors to each point. Finally, we add the point series to our PointLineSeries3D object.
- Set dimensions correct with current data:
_chart.BeginUpdate();
                    if (CBAppend.IsChecked == false)
                    {
                        _chart.View3D.PointLineSeries3D = new List<PointLineSeries3D>();
                        _chart.View3D.SurfaceGridSeries3D = new List<SurfaceGridSeries3D>();
                    }

                    _chart.View3D.PointLineSeries3D.Add(_pls3d);
                    _chart.View3D.XAxisPrimary3D.SetRange(xmin, xmax + columnslenght);
                    _chart.View3D.YAxisPrimary3D.SetRange(0, 100);
                    _chart.View3D.ZAxisPrimary3D.SetRange(zmin, zmax + rowslenght);

                    int point = 0;
                    for (int i = 0; i < _chart.View3D.PointLineSeries3D.Count; i++)
                    {
                        point += _chart.View3D.PointLineSeries3D[i].PointCount;
                    }
The BeginUpdate function disables control repaints when a property is changed which is handy when updating status of many properties or updating series points.
If we have the append UI combo box checked, the point series will be appended to the current object. If not, the current object will be replaced by the new point series.
The axes ranges will be increased by getting the adding the column and row length to the max range values. This is done to give more room for movement within the lidar chart. Finally, we count the points to be displayed as UI information.
CreateChart2()

The past method (CreateChart) creates the 3D map using only the Line Point Series chart type. That means, we only create points to generate a 3D map. The second CreateChart method allows us to use the Surface Grid chart type, allowing us to generate a solid 3D object.
The past method (CreateChart) creates the 3D map using only the Line Point Series chart type.
That means, we only create points to generate a 3D map.
The second CreateChart method allows us to use the Surface Grid chart type, allowing us to generate a solid 3D object.
Surface Grid
The SurfaceGridSeries3D will allow us to visualize the topographic LiDAR chart data for the LiDAR chart as a 3D surface visualization. So, when using the SurfaceGridSeries3D, the nodes are evenly distributed in the X dimensions and Z dimensions.
The SurfaceGridSeries3D will allow us to visualize the topographic LiDAR chart data for the LiDAR chart as a 3D surface visualization.
So, when using the SurfaceGridSeries3D, the nodes are evenly distributed in the X dimensions and Z dimensions.
Node distances are automatically calculated as
𝑛𝑜𝑑𝑒 𝑑𝑖𝑠𝑡𝑎𝑛𝑐𝑒 𝑋 = RangeMaxX – RangeMinX / SizeX − 1
𝑛𝑜𝑑𝑒 𝑑𝑖𝑠𝑡𝑎𝑛𝑐𝑒 𝑍 = RangeMaxZ – RangeMinZ /SizeZ − 1
To use this method, you must disable the [Point Cloud] option and execute the [Load all files] button. The method starts the same as the past method.
First the configuration values are obtained located within the first 5 rows.
_surfaceGrid = new SurfaceGridSeries3D();
                    _surfaceGrid.AllowUserInteraction = false;
                    _surfaceGrid.ContourLineType = ContourLineType3D.None;
                    _surfaceGrid.WireframeType = SurfaceWireframeType3D.None;
                    SurfacePoint[,] _SurfacePoint = new SurfacePoint[data[file].Length - 6, data[file].Length - 6];
We create our Surface Grid chart type object. We specify the limits of our surface. We use the total rows of our file as the boundary of our surface.
To set surface grid data:
- Set X range by using RangeMinX and RangeMaxX properties, to order the minimum and maximum value based on assigned X axis.
- Set Z range by using RangeMinZ and RangeMaxZ properties, to order the minimum and maximum value based on assigned Z axis.
- Set SizeX and SizeZ properties to give the grid a size as columns and rows.
- Set Y values for all nodes:
for (int i = 6; i < data[file].Length; i++)
                    {
                        string[] cols = data[file][i].Split(' ');
                        for (int x = 0; x < cols.Length; x++)
                        {
                            if (float.TryParse(cols[x], NumberStyles.Float, provider, out float yval))
                            {
                                if (yval != emptyspace)
                                {
                                    _SurfacePoint[x, data[file].Length - 1 - i].Y = yval;
                                }
                            }

                        }
                    }
All the values for each point are added to the SurfaceGrid Series object. The values are stored in the _surfaceGrid object and passed as a parameter to the Add function.
_chart.View3D.SurfaceGridSeries3D.Add(_surfaceGrid);Finally, the ranges of the 3D object are increased, and the title is changed to “Surface Grid Series”. The logic is the same as the past method.
Final Application
Here’s the final LiDAR chart application displaying topographic data from London that all together renders 56 million data points.
In conclusion, LiDAR technology collects environment data. When using high-performance charting components for visualizing LiDAR data, large amounts of data can be processed quickly, enabling real-time analysis and visualization. This can be particularly useful in applications such as autonomous vehicles, where rapid data processing is essential for safe and efficient operation.
High-performance LiDAR charting components can also create more detailed and accurate visualizations.
See you in the next article!
In conclusion, LiDAR technology collects environment data.
When using high-performance charting components for visualizing LiDAR data, large amounts of data can be processed quickly, enabling real-time analysis and visualization.
This can be particularly useful in applications such as autonomous vehicles, where rapid data processing is essential for safe and efficient operation.
High-performance LiDAR charting components can also create more detailed and accurate visualizations.
See you in the next article!

