


High-Performance Gauge Controls for .NET Dashboards
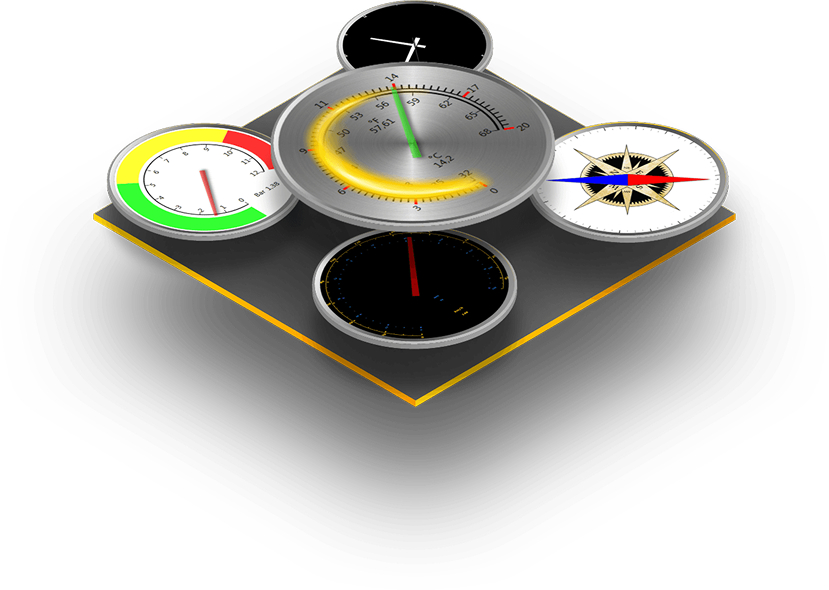
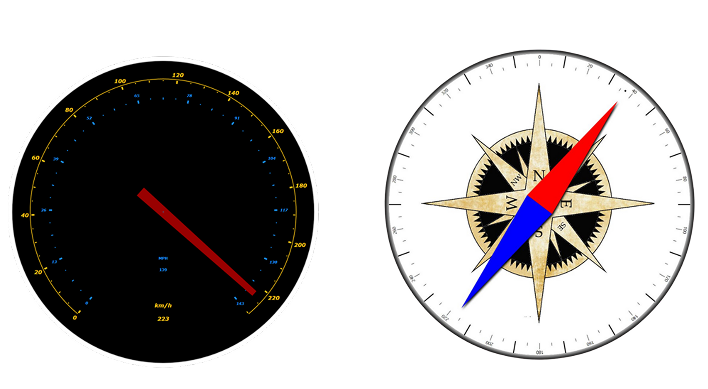
LightningChart® Gauges deliver professional-grade radial, angular, and digital meters with unmatched performance and flexibility for WPF and Silverlight applications.
Visualize Data with Precision
LightningChart® Gauges are engineered for demanding real-time applications where both accuracy and responsiveness are critical. Built on the same high-performance rendering engine as LightningChart’s charting solutions, the gauges deliver smooth, flicker-free updates even with hundreds of instruments on screen
Engineered for Performance
Each gauge can include multiple scales, logarithmic or linear ranges, unlimited needles, and fully customizable visuals — from labels and tick marks to gradients and warning zones. With full support for WPF and Silverlight data binding, the gauges integrate seamlessly into professional dashboards without compromising performance.
Get the complete technical reference, including API details, customization options,


Requirements for Silverlight
Microsoft Visual Studio 2010 – 2015 The latest Silverlight .NET framework. Windows Vista, 7, 8, 8.1, 10, Windows Server 2008 (R2 SP1,SP2)/2012(R2); 32 bit or 64 bit. 1.6 GHz or higher processor with 512-megabytes (MB) of RAM
Requirements for WPF
Microsoft Visual Studio 2010 – 2022 .NET 4.0 framework or newer, also Client Profile Windows Vista, 7, 8, 8.1, 10; 32-bit or 64-bit.
Frequently Asked Questions
Can I use multiple scales and needles in a single gauge?
Yes. Gauges support one primary scale and any number of secondary scales. Each scale can have its own needle, allowing you to display multiple measurements on the same gauge.
Are gauge elements vector-based?
Yes. The graphics are vector-based, meaning they scale smoothly without losing quality, even when resized or used in high-resolution applications.
How customizable are the gauge visuals?
Gauges are highly customizable. You can modify angles, borders, padding, tick marks, label formatting, needle shapes, fills, gradients, and more. Almost every visual element — including scales, ticks, needles, backgrounds, and numeric value displays — can be styled in detail.
Are LightningChart Gauges suitable for real-time applications?
Yes. Gauge values are fully bindable and react immediately to changes in the underlying data source, making them suitable for real-time monitoring scenarios.
What frameworks are supported?
Gauges are available for .NET-based frameworks, including WPF and Silverlight. They integrate naturally into XAML-based applications.
Can I bind gauge values to live data sources?
Yes. Gauge properties — including the current value — support standard data binding patterns (such as MVVM), enabling easy connection to dynamic or live data streams.
Do gauges support both positive and negative values?
Yes. You can freely set the scale’s numeric range using RangeBegin and RangeEnd, including ranges that span negative values.
Can I display multiple units or measurement types on a single gauge?
Yes. By using secondary scales and their associated needles, you can present different units or measurement types simultaneously, each with its own scale styling.
LightningChart .NET
Do you need advanced .NET data visualization components? Take a look at LightningChart .NET charts, the fastest and most advanced WPF, UWP & WinForms data visualization toolkit ever made.


If you have any questions, feel free to contact us!
©LightningChart Ltd 2025. All rights reserved.