PointLineSeries3D
PointLineSeries3D allows presenting points and line in 3D space. For points, there are many basic 3D shapes available. Points are connected together with a line, if LineVisible property is set True.
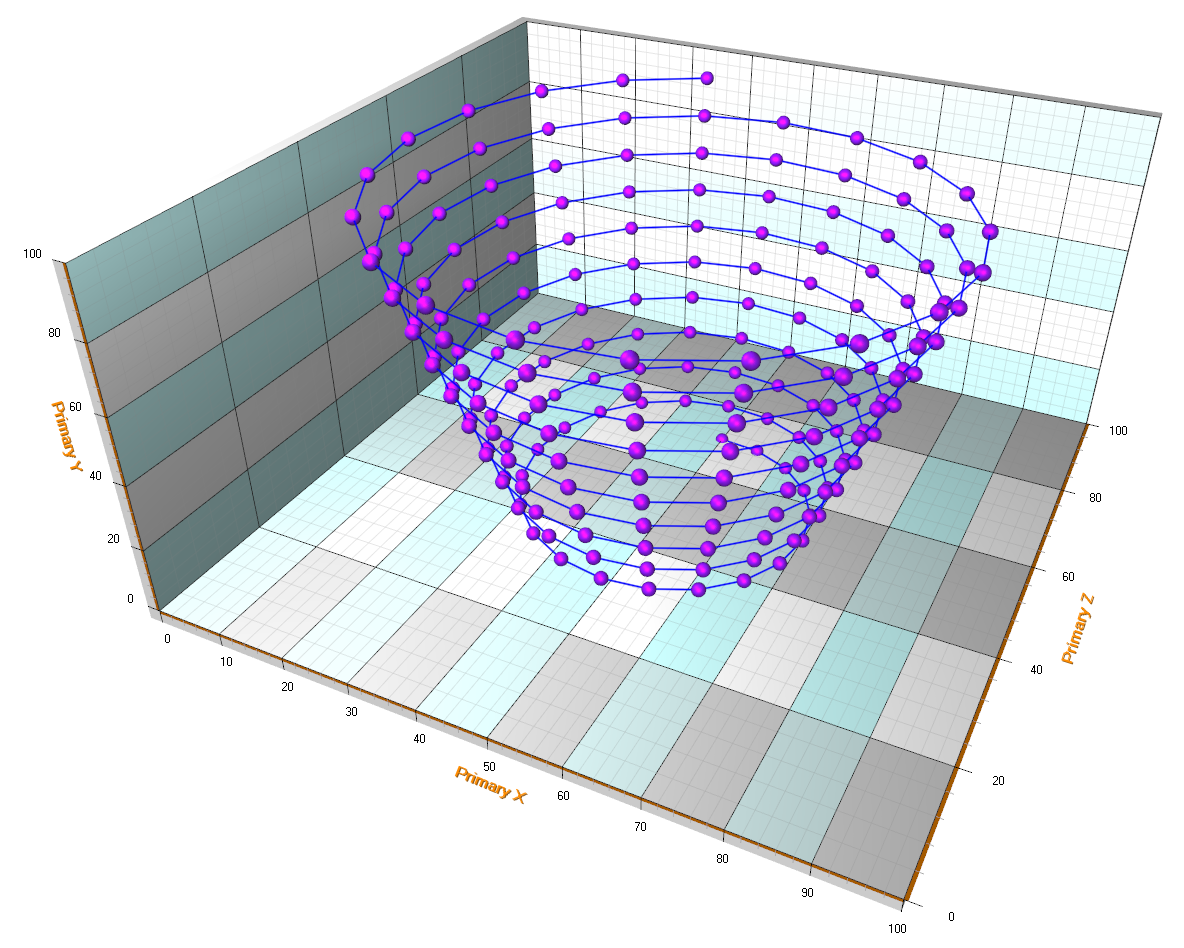
A PointLineSeries3D example. PointStyle’s Shape is set to Sphere.
Point styles
Points can be shown as real 3D points, or as 2D shapes (which is better as far as performance). It is controlled by PointStyle. ShapeType property. Shape2D will have faster performance, while Shape3D is more stylish and represent 'true 3D object' (with depth perception and interaction with Lights).
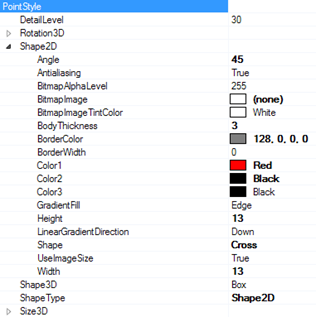
PointStyle property tree. ShapeType can be used to switch between 2D and 3D shapes.
If ShapeType is set as Shape2D, then PointStyle. Shape2D property tree controls point's style. Essentially it is all the same properties as XY PointStyle. 2D shape is alway flat and faces viewer.
If ShapeType is set as Shape3D, then properties PointStyle. Shape3D (with options Box, Sphere, Cylinder, Cone, Torus, Ellipsoid), PointStyle. Size3D (with Width, Height and Depth properties in units of World coordinates), PointStyle. DetailLevel and series. Material control point's style.
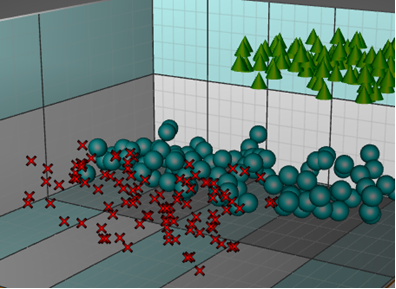
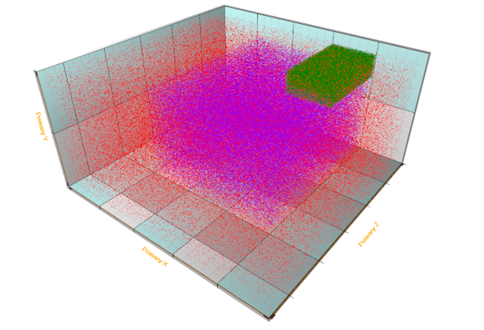
Red crosses have ShapeType = Shape2D. Teal and Green objects have ShapeType = Shape3D.
2D shapes are rendered on top of all 3D objects and they don't have any support for hiding them based on other objects visibility.
Line styles
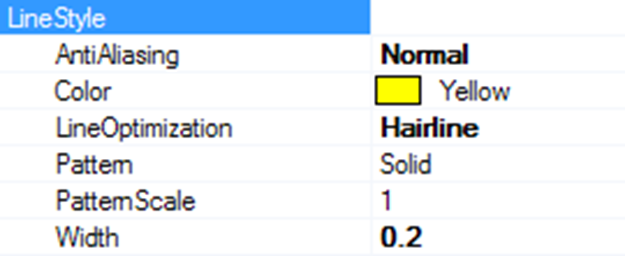
LineStyle properties
The lines can be rendered as shaded 3D lines or as a one pixel wide hair line.
When having a lot of data in the series, setting LineOptimization = Hairline is recommended to avoid performance issues. When LineOptimization is set for Normal or NormalWithShading options, LineStyle. Width property control line thickness in units of World coordinates.
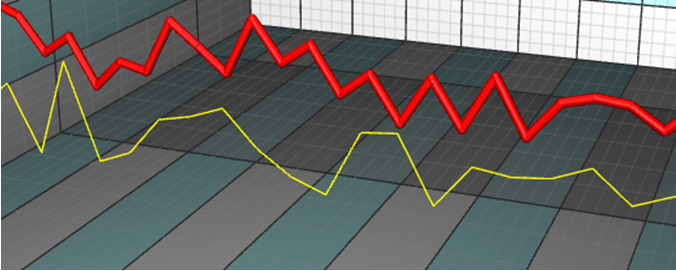
Yellow line: LineStyle.LineOptimization = Hairline. Red Line: LineStyle.LineOptimization =
NormalWithShading.
In addition to LineStyle settings, PointLineSeries3D has ClosedLine property, which when enabled, automatically connects the first and the last data points of the series. This property is available from LightningChart version 9.0 onwards.
// Connecting the first and the last points
pointLineSeries3D.ClosedLine = true;
For optimizing semi-transparent lines, see TransparencyRenderMode.
Adding points
PointLineSeries3D supports three different point formats:
- Points property (SeriesPoint3D array)
- PointsCompact property (SeriesPointCompact3D array)
- PointsCompactColored property (SeriesPointCompactColored3D array)
PointsCompact and PointsCompactColored structures are very memory efficient, allowing up to 100 million data points visualization with simple point styles. Set the point format via PointsType property.
Points
By using Points property, all the advanced coloring options of points are supported. SeriesPoint3D structure consists of the following fields:
- double X: X axis value
- double Y: Y axis value
- double Z: Z axis value
- Color Color: individual data point color, only applies when IndividualPointColors is enabled, or MultiColorLine is enabled.
- float SizeFactor: size factor multiplies the size defined by PointStyle. Size. Only applies when using IndividualPointSizes is enabled.
- object Tag: freely assignable auxiliary object, for example to attach some details.
Series points must be added in code. Use AddPoints(…) method to add points to the end of existing points.
SeriesPoint3D[] pointsArray = new SeriesPoint3D [3];
pointsArray [0] = new SeriesPoint3D (50, 50, 50);
pointsArray [1] = new SeriesPoint3D (30, 50, 20);
pointsArray [2] = new SeriesPoint3D (80, 50, 80);

//Add points to the end
chart.View3D.PointLineSeries3D[0].AddPoints(pointsArray);
To set whole series data at once while overwriting old points, assign the new point array directly:
chart.View3D.PointLineSeries[0].Points = pointsArray; //Assign the points array
PointsCompact
PointsCompact property enables low memory consumption, which is important when having a lot of data points. SeriesPointCompact3D structure consists of the following fields:
- double X: X axis value
- double Y: Y axis value
- double Z: Z axis value
Series points must be added in code. Use AddPoints(…) method to add points to the end of existing points.
SeriesPointCompact3D[] pointsArray = new SeriesPointCompact3D[3];
pointsArray [0] = new SeriesPointCompact3D(50, 50, 50);
pointsArray [1] = new SeriesPointCompact3D(30, 50, 20);
pointsArray [2] = new SeriesPointCompact3D(80, 50, 80);

//Add points to the end
chart.View3D.PointLineSeries3D[0].AddPoints(pointsArray);
To set whole series data at once while overwriting old points, assign the new point array directly:
//Assign the points array
chart.View3D.PointLineSeries[0].PointsCompact = pointsArray;
PointsCompactColored
PointsCompactColored property enables low memory consumption, important when having a lot of data points, but still allows coloring the points with individual colors.
SeriesPointCompactColoured3D structure consists of the following fields:
- float X: X axis value
- float Y: Y axis value
- float Z: Z axis value
- int Color: Color of the point
SeriesPointCompactColored3D[] pointsArray = new SeriesPointCompactColored3D[3];
pointsArray [0] = new SeriesPointCompactColored3D(50, 50, 50, Color.Blue.ToArgb());
pointsArray [1] = new SeriesPointCompactColored3D(30, 50, 20, Color.Red.ToArgb());
pointsArray [2] = new SeriesPointCompactColored3D(80, 50, 80, Color.Green.ToArgb());

//Add points to the end
chart.View3D.PointLineSeries3D[0].AddPoints(pointsArray);
To set whole series data at once while overwriting old points, assign the new point array directly:
//Assign the points array
chart.View3D.PointLineSeries[0].PointsCompactColored = pointsArray;
Coloring points individually
By setting IndividualPointColors = True, the Color fields of points apply instead of Material. DiffuseColor.
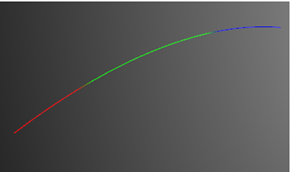
IndividualPointColors in use.
Individual point coloring is not supported when having PointsType = PointsCompact.
Setting points sizes individually
By setting IndividualPointSizes = True, SizeFactor fields from the points take effect. The factor multiplies the size defined in PointStyle.Size.
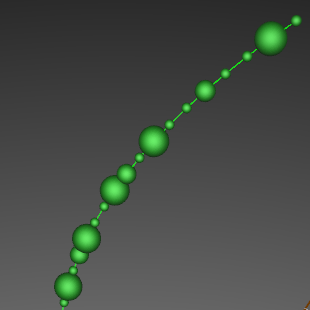
IndividualPointSizes in use.
Individual point sizes are not supported when having PointsType = PointsCompact, or PointsCompactColored.
Multi-coloring line
To color the line with given data point colors, set MultiColorLine = True. The chart interpolates the color gradients between adjacent points.
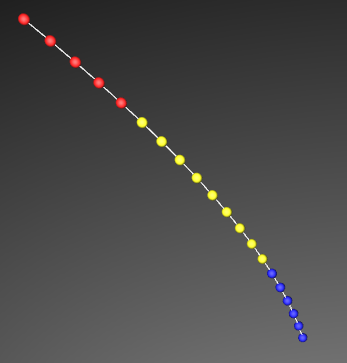
MultiColorLine enabled
MultiColorLine is not supported when having PointsType = PointsCompact.
Displaying millions of scatter points
To be able to show a very high count of scatter points, set PointsOptimization = Pixels. Then each series point will be rendered as a single pixel. When having to show 10 million or 100 million data points, use the PointsCompact or PointsCompactColored approach to keep memory requirements functional.
Millions of scatter points. LineVisible = False, PointsVisible = True, PointsOptimization = Pixels.
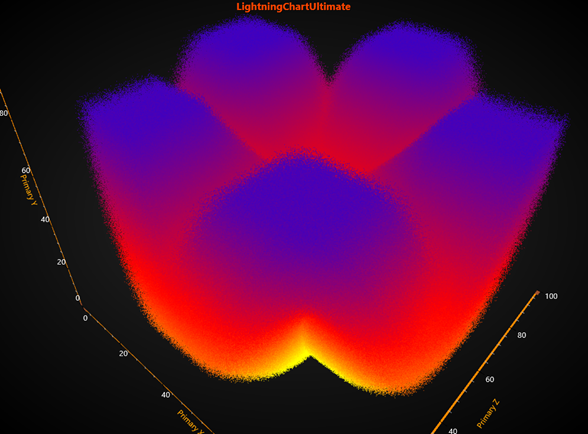
IndividualPointsColoring = True, using PointsCompactColored, LineVisible = False, PointsVisible = True. 120 million of scatter points.
Millions of data points can be most efficiently visualized with rectangles. When using PointsCompactColored or PointsCompact, the point size can be controlled with PointStyle.Shape2D.Width and PointStyle.Shape2D.Height.
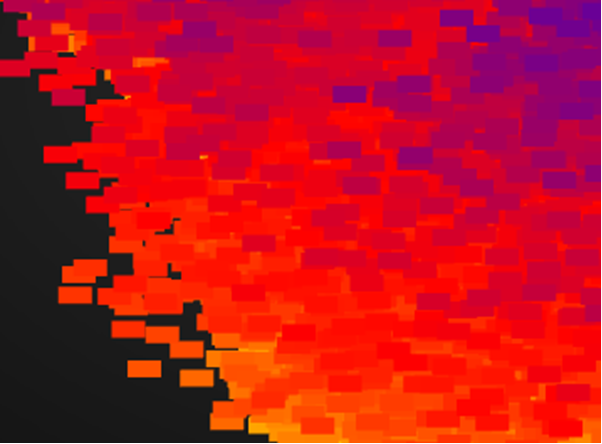
PointStyle.Shape2D.Width = 20 and PointStyle.Shape2D.Height = 10.
Examples
To see feature demonstration as example, check Points3D, PointLines3D, PointTracking3D, PointCloud3D, ExampleLidar, MultiColoredPoint, ParallelCoordinates3D and CamerasAndLights from our Demo.