SurfaceGridSeries3D
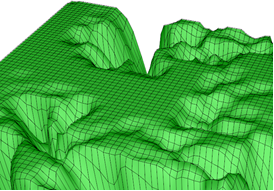
SurfaceGridSeries3D allows visualizing data as a 3D surface. In SurfaceGridSeries3D, nodes are equally spaced in X dimension, and in Z dimension as well.
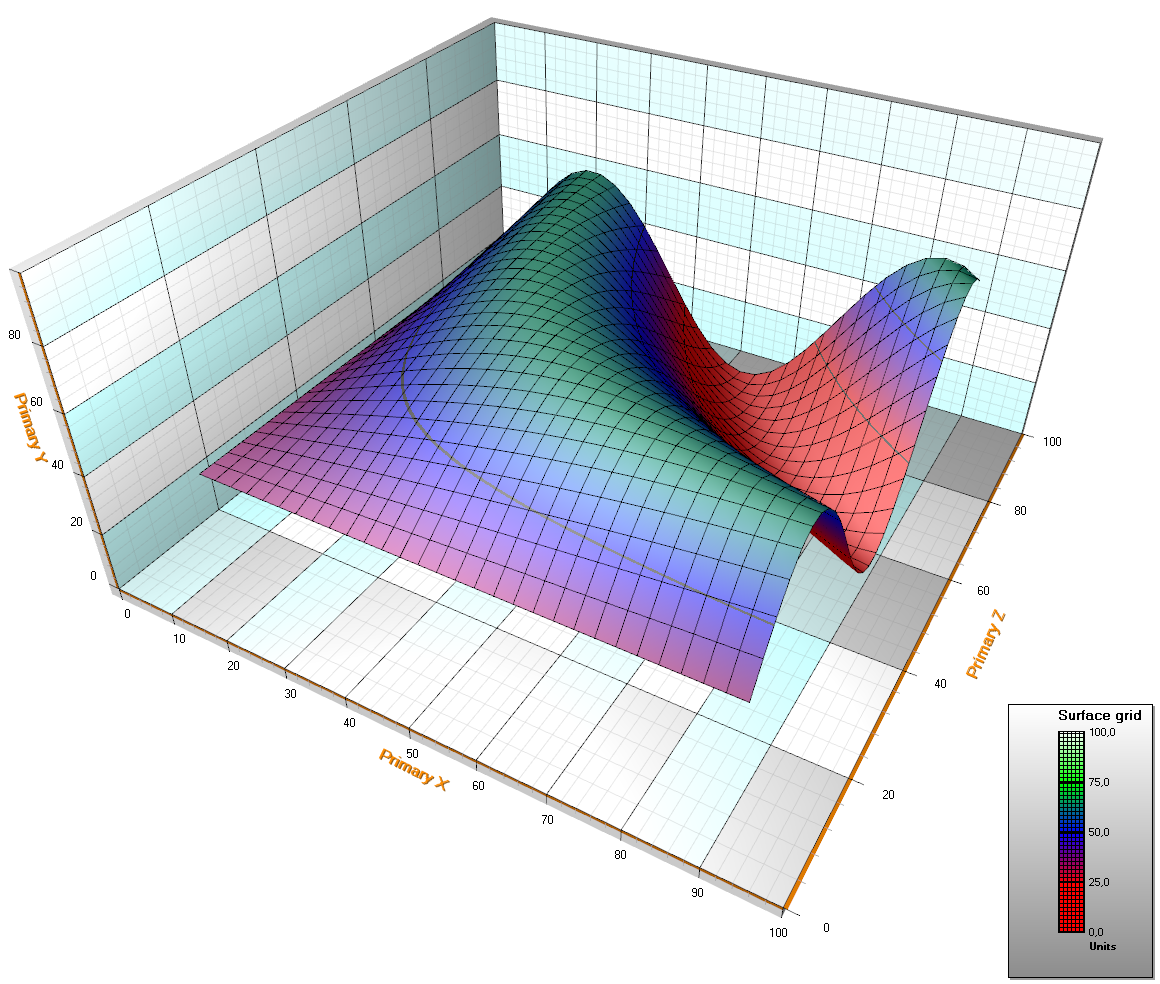
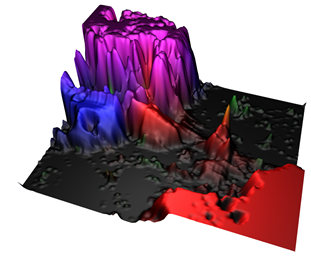
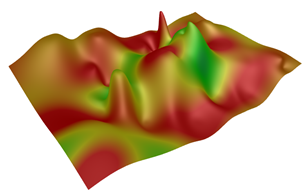
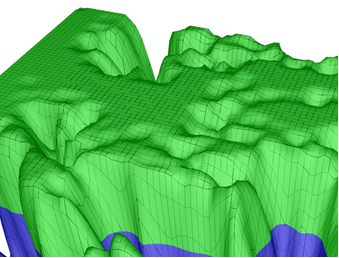
Surface grid series with default style. Height data is made with a sine formula. Legend box shows the height coloring intervals.
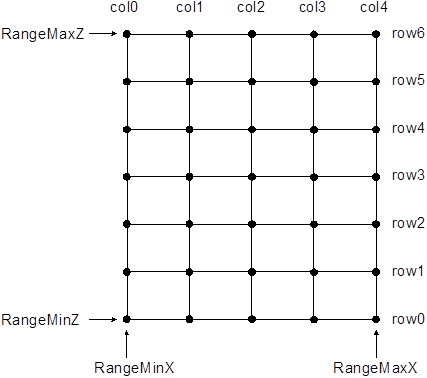
Surface grid nodes. SizeX = 5, SizeZ = 7.
Setting surface grid data
- Set X range by using RangeMinX and RangeMaxX properties, to order the minimum and maximum value based on assigned X axis.
- Set Z range by using RangeMinZ and RangeMaxZ properties, to order the minimum and maximum value based on assigned Z axis.
- Set SizeX and SizeZ properties to give the grid a size as columns and rows.
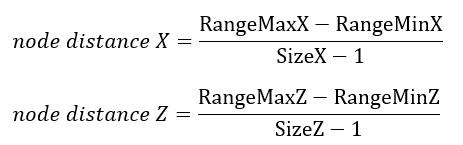
Node distances are automatically calculated as
- Set Y values for all nodes:
for (int nodeIndexX = 0; nodeIndexX < columnCount; nodeIndexX ++)
{
	for (int nodeIndexZ = 0; nodeIndexZ < rowCount; nodeIndexZ ++)
     	{
		  Y =//some height value.
	  gridSeries.Data[iNodeX, iNodeZ].Y = Y;
     	}
}
// Notify to refresh when the new values are ready
gridSeries.InvalidateData();
for (int nodeIndexX = 0; nodeIndexX < columnCount; nodeIndexX ++)
{
	for (int nodeIndexZ = 0; nodeIndexZ < rowCount; nodeIndexZ ++)
        {
            Y =//some height value
              gridSeries.SetDataValue(nodeIndexX, nodeIndexX,
                0, //X value ís irrelevant in grid
                Y,
                0,//Z value is irrelevant in grid
                Color.Green); //Source point colors are not used in this example, so use any color here
        }
}
// Notify to refresh when the new values are ready
gridSeries.InvalidateData();
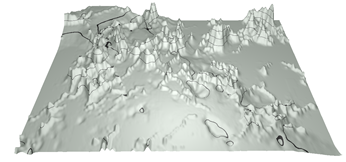
Creating surface from bitmap file
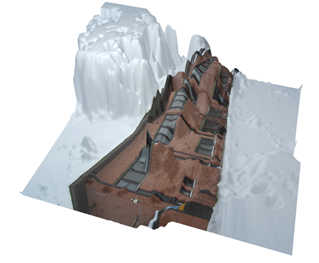
Surfaces can be created from bitmap images by using SetHeightDataFromBitmap method. The surface gets the size of the bitmap (if no anti-aliasing or resampling is used). For each bitmap image pixel, Red, Green and Blue values are summed. The greater the sum, the higher will be the height data value for that node. Black and dark colors get lower values while bright and white colors get higher values.
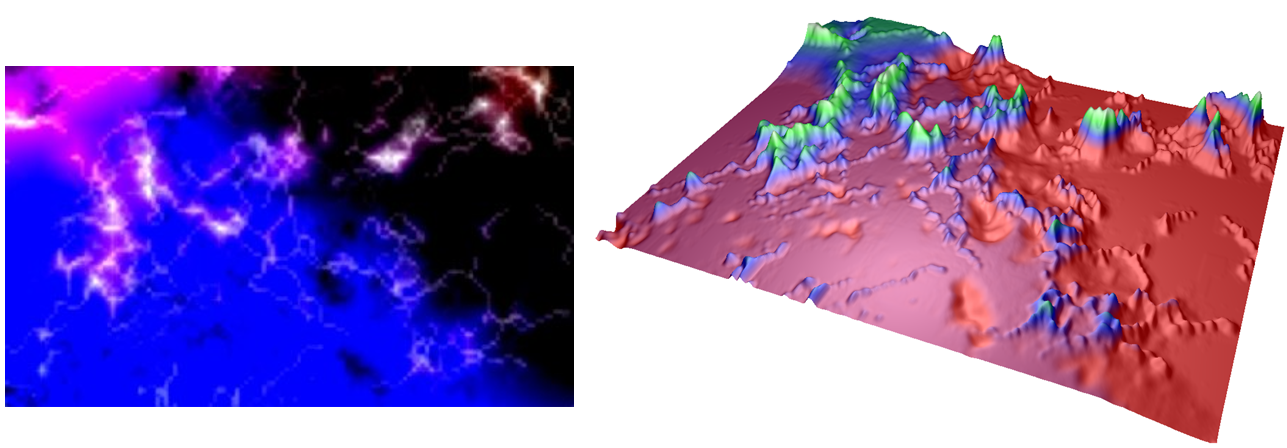
Source bitmap and calculated surface height data. Dark values stay low while bright values get higher in the surface.
Fill styles
Use Fill property to select the filling style of the surface. The following options are available:
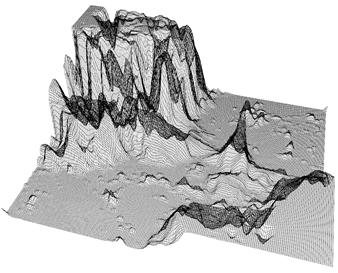
- None: By using this, no filling is applied. This selection is useful with wireframe meshes.
- FromSurfacePoints: The colors of the Data property nodes are used.
- Toned: ToneColor applies
- PalettedByY: Coloring by Y values by palette, see Contour palette.
- PalettedByValue: Coloring by SurfacePoint's Value fields by palette, see Contour palette.
- Bitmap: Bitmap image is stretched to cover the whole surface. Set the bitmap image in BitmapFill property. BitmapFill property has sub-properties to mirror the image vertically and horizontally.
FromSurfacePoints fill. Color per data point.
Toned fill.
PalettedByY
Bitmap fill.
PalettedByValue
Contour palette
ContourPalette property allows defining color steps for height coloring. ContourPalette can be used for:
An unlimited count of steps can be defined for contour palette. Each step has a height value and a corresponding color.
The palette includes MinValue, Type and Steps properties. For Type, there are two choices: Uniform and Gradient. The contour palette of below figure:
- MinValue: 0
- Type: Gradient
- Steps:
- Steps[0]: MaxValue: 25, Color: Red
- Steps[1]: MaxValue: 50, Color: Blue
- Steps[2]: MaxValue: 75, Color: Lime
- Steps[3]: MaxValue: 100, Color: White
The height values below first step value are colored with first step’s color.
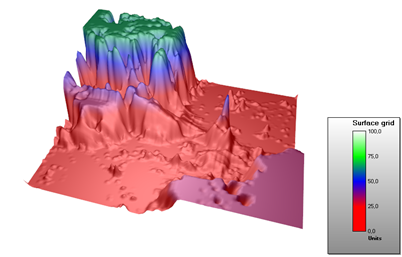
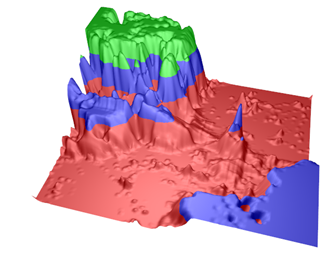
Surface grid series contour palette Type is set to Gradient.
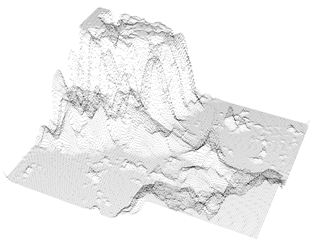
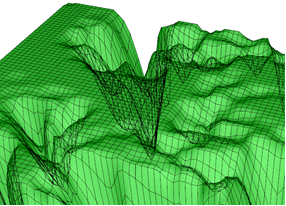
Wireframe mesh
Use WireframeType to select the wireframe style. The options are:
- None: no wireframe
- Wireframe: a solid color wireframe. Use WireframeLineType.Color to set the color.
- WireframePalettedByY: wireframe coloring follows SurfacePoint's Y field ContourPalette (see Contour palette).
- WireframePalettedByValue: wireframe coloring follows SurfacePoint's Value field, ContourPalette (see Contour palette).
- WireframeSourcePointColored: wireframe coloring follows the color of the surface nodes
- Dots: wireframe lines consist of solid color dots.
- DotsPalettedByY: wireframe lines consist of dots colored by ContourPalette according to Y field of SurfacePoints.
- DotsPalettedByValue: wireframe lines consist of dots colored by ContourPalette according to Value field of SurfacePoints.
- DotsSourcePointColored: wireframe lines consist of dots whose coloring follows the color of the surface nodes.
Wireframe line style (Color, Width, Pattern) can be edited via WireframeLineStyle.
Palette colored wireframe lines and dots may conflict with WireframeLineStyle.Pattern settings, for example Dash linestyle with wireframe set to Dots. Use solid line in one or the other.
WireframeType = Wireframe.
WireframeType = WireframePalettedByY.
WireframeType = SourcePointColored.
WireframeType = Dots.
WireframeType = DotsPalettedByY.
WireframeType = DotsSourcePointColored.
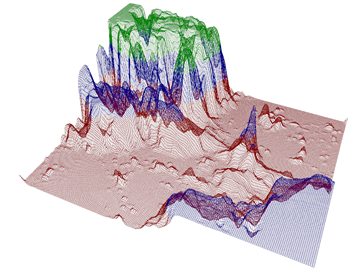
Wireframe simultaneously with fill
When fill and wireframe are drawn in the same position in 3D model, Z-fighting may appear. It can be seen as broken wireframe lines. That is because it is impossible for the GPU to determine which object is closer to camera.
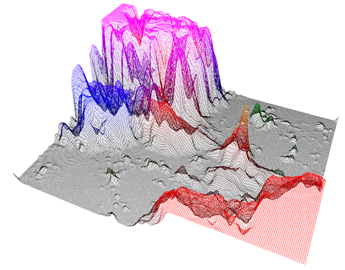
Surface grid wireframe with filling. Z-fighting appears as broken wireframe lines.
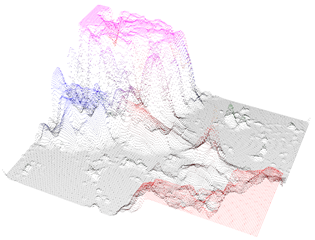
To prevent Z-fighting from occurring, use WireframeOffset or DrawWireframeThrough property. By using WireframeOffset, the wireframe is moved slightly in 3D model space. DrawWireframeThrough draws the wireframe through the filling, whether or not the part of the surface is visible to the camera.
WireframeOffset = (X=0; Y=0.1; Z=0).
DrawWireframeThrough is enabled.
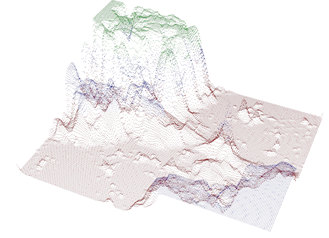
Contour lines
Contour lines allow quick interpretation of height data without filling the surface with paletted fill. Contour lines can be used combined with fill and wireframe. By setting ContourLineType property, contour lines can be drawn with different styles:
- None: no contour lines are shown
- FastColorZones: The lines are drawn as thin vertical zones. Allows very powerful rendering, which suits well for continuously updated or animated surface. Steep height changes are shown as thin line, as gently sloping height differences are shown with thick line. All lines use the same color defined as ContourLineColor property. The zone height can be set by FastContourZoneHeight property.
- FastPalettedZones: Like FastColorZones, but line coloring follows ContourPalette options (see Contour palette).
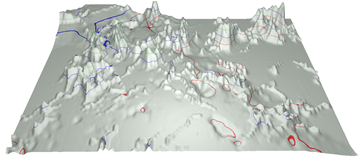
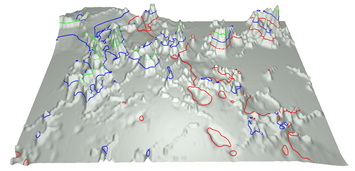
- ColorLineByY and ColorLineByValue: Contour lines are made with actual lines. Rendering takes longer than FastColorZones. The line width and color can be adjusted with ContourLineWidth and ContourLineColor properties. Contour lines can also be shifted with WireframeOffset property (if ContourLineWidth ≤1), to remove possible Z-fighting with filling.
- PalettedLineByY and PalettedLineByValue: like ColorLineByY and ColorLineByValue, but line coloring follows ContourPalette options (see Contour palette).
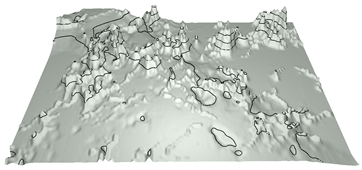
ContourLineType = FastColorZones.
ContourLineType = FastPalettedZones.
ContourLineType = ColorLine.
ContourLineType = PalettedLine.
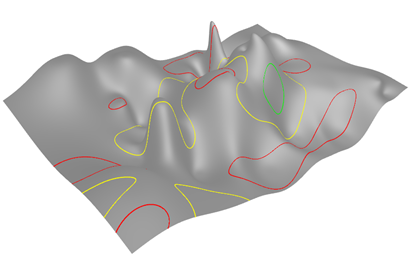
ContourLineType = PalettedLineByValue.
Fadeaway
SurfaceGridSeries3D, SurfaceMeshSeries3D and WaterfallSeries3D have a FadeAway property, which allows fading away the series towards the back of the chart. FadeAway is measured in percents, valid range being from 0 (no fadeaway, the default value) to 100 (full fadeaway). The higher the value, the more transparent the data with high Z value will become.
Scrolling surface data
SurfaceGridSeries3D and SurfaceMeshSeries3D have InsertRowBackAndScroll and InsertColumnBackAndScroll methods for performance optimized periodical data adding. They insert a new data row or column into the surface series’ data table while dropping the oldest values, i.e. the first data row off. Consider the following 3D spectrum display (figure below). New FFT values are added as a new row (close to camera), and the old data and the time axis (Z axis) must be scrolled. The oldest surface values must be dropped off.
InsertRowBackAndScroll and InsertColumnBackAndScroll take the new data as a double array, but also require new minimum and maximum values for both surface series and the scrolled axis (Z dimension/axis for InsertRowBackAndScroll and X dimension/axis for InsertColumnBackAndScroll). This constant adjusting of series and axis ranges enables the scrolling effect.
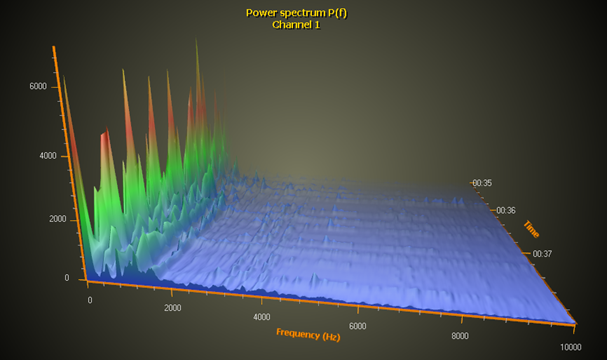
Presenting 3D spectrum with surface grid. InsertRowBackAndScroll method is used for performance optimized data adding. Fadeaway property is 100 to make the surface smoothly fade away towards the back of the chart. A perspective camera is used.
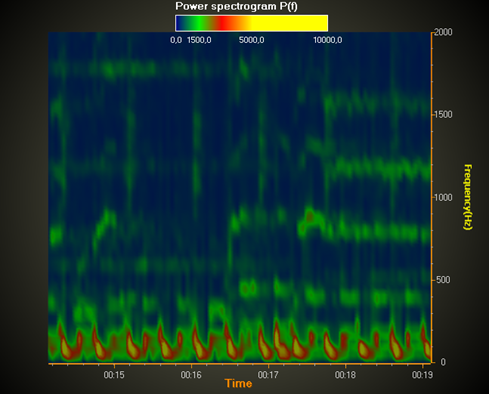
A spectrogram with surface grid. InsertColumnBackAndScroll method is used. An orthographic camera above the model gives straight and perpendicular projection. SuppressLighting is enabled to remove unwanted light reflections. Fadeaway = 0 for making the grid series fully visible.
Handling transparency
Examples
To see feature demonstration as example, check SimpleSurfaceGrid3D, SurfaceFlatContourProjection, SurfaceGridValueColored and SurfaceWater3D from our Demo.