View3D overview
View3D allows visualizing data in 3D space. 3D model can be zoomed, rotated and lit up with various ways. Different series types can be placed into the same 3D view to make a combined visualization.
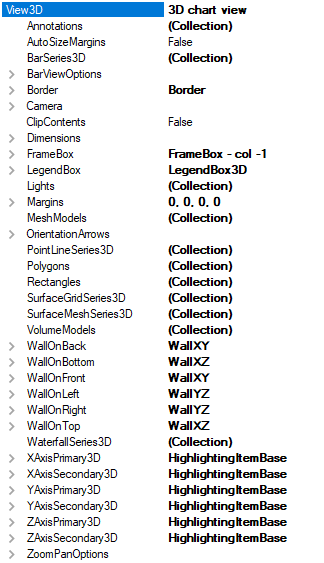
View3D object main tree.
3D model and dimensions
3D model is constructed in the center of 3D world. Dimension magnitudes define the size of the model box in 3D space. Walls and axis sizes are defined with this dimension box. Use the Dimensions property to set each dimension magnitude.
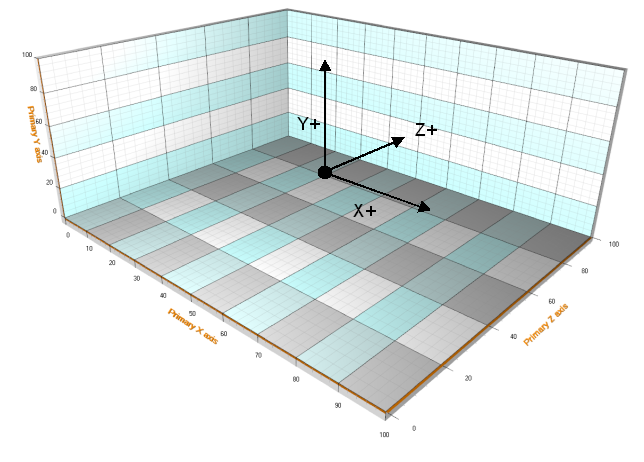
When camera rotation is not defined, positive X direction is to the right, positive Y dimension upwards and positive Z direction inwards to the screen.

3D model positive and negative directions
World coordinates
Some 3D objects use “World coordinates”, not axis values. For example, lights are positioned this way to be independent from axis ranges. World coordinates can be called also as “3D model space coordinates”.
The origin [0,0,0] is in the center of the model. The actual 3D model space ranges from [-Dimensions.X/2 to Dimensions.X/2], [-Dimensions.Y/2 to Dimensions.Y/2] and [-Dimensions.Z/2 to Dimensions.Z/2].
Example of 3D view setup. Dimensions are set to X=100, Y=40, Z=80. Walls visible: left, bottom, back. Perspective camera is used.
LightningChart provides methods to convert values between series values, axis values, world coordinates and screen coordinates.
Converts 3D world space coordinate to series value, using the axes bound to the series.public PointDouble3D Convert3DWorldCoordToSeriesValue(SeriesBase3D series, double x, double y, double z)
public PointInt[] Convert3DWorldCoordsToScreenCoords(CoordXYZ[] coordsW)
// 'Normal' point
public CoordXYZ[] ConvertSeriesPointsTo3DWorldCoords(SeriesBase3D series, SeriesPoint3D[] points)

// PointsCompact
public CoordXYZ[] ConvertSeriesPointsTo3DWorldCoords(SeriesBase3D series, SeriesPointCompact3D[] points)

// PointsCompactColored
public CoordXYZ[] ConvertSeriesPointsTo3DWorldCoords(SeriesBase3D series, SeriesPointCompactColored3D[] points)
// 'Normal' point
public PointInt[] ConvertSeriesPointsToScreenCoords(SeriesBase3D series, SeriesPoint3D[] points)

// PointsCompact
public PointInt[] ConvertSeriesPointsToScreenCoords(SeriesBase3D series, SeriesPointCompact3D[] points)

// PointsCompactColored
public PointInt[] ConvertSeriesPointsToScreenCoords(SeriesBase3D series, SeriesPointCompactColored3D[] points)
public PointDouble3D ConvertSeriesValueRangesTo3DWorldRanges(SeriesBase3D series, double xValueRange, double yValueRange, double zValueRange)
public PointDouble3D ConvertSeriesValueTo3DWorldCoord(SeriesBase3D series, double x, double y, double z)
public PointInt ConvertSeriesValueToScreenCoord(SeriesBase3D series, double x, double y, double z)
3D Walls
Walls (WallOnFront, WallOnBack, WallOnTop, WallOnBottom, WallOnLeft, WallOnRight) are used to present axis grids and gridstrips and to give a base for the axes. By default, bottom, left, right, back and front walls are visible. Their AutoHide property is set true. When rotating the view, the obstructing walls are temporarily hidden so that they don’t block the view of chart contents. To force a wall visible, set Visible = true and AutoHide = false.
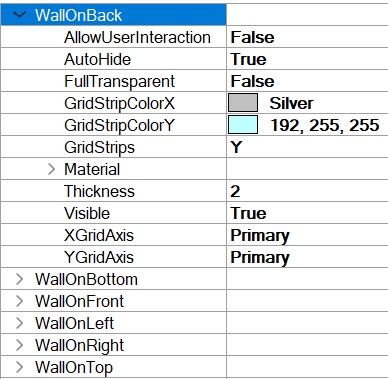
View3D Wall object properties.
Use XGridAxis, YGridAxis, ZGridAxis, GridStripColorX, GridStripColorY, GridStripColorZ and GridStrips properties to select from which axes the grid is applied, and to modify the coloring of the grid strips. The available properties depend on the wall orientation. FullTransparent property allows showing only the grid while hiding the solid wall. Note that even if FullTransparent is enabled, the grid still follows Visible and AutoHide properties of the wall.
3D FrameBox
A simplified 3D box presentation can be used instead of walls. Set Visible = false for every wall, then set FrameBox.Style = AllEdges. Set the color or the frame with FrameBox.LineColor.
FrameBox visible, walls are hidden.
3D Camera

Camera properties
Camera type, location, distance and target together determine the 3D viewpoint. Use RotationX, RotationY, RotationZ and ViewDistance to set the camera position in the 3D model space. Target the camera to preferred direction by setting the Target property.
Select projection type with Projection property.
- Perspective, shows a realistic projection.
- Orthographic, projection type used in scientific and engineering applications. This selection is recommended over OrthographicLegacy.
- OrthographicLegacy, (equivalent to OrthoGraphicCamera = True in LightningChart v.8.3 and earlier). This is slower to render after zooming compared to Orthographic. It maintains the sizes of the 3D objects, if they are defined in 3D world coordinates (not axis values). Also, the thickness of the walls stays the same when zooming. Zooming changes the dimensions but does not affect ViewDistance.
RotationX, RotationY and RotationY can be limited by setting boundaries via RotationXMinimum, RotationXMaximum, RotationYMinimum, RotationYMaximum, RotationZMinimum and RotationZMaximum properties.
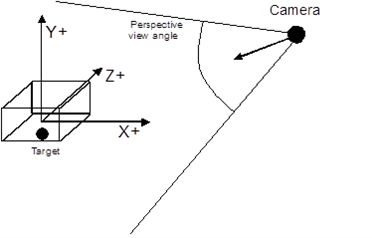
Perspective camera presentation in 3D space.
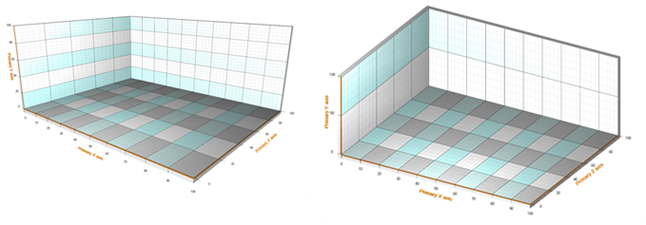
Perspective and orthographic camera views in 3D space.
Zoomed view in Orthographic and OrthographicLegacy differ as follows:
Orthographic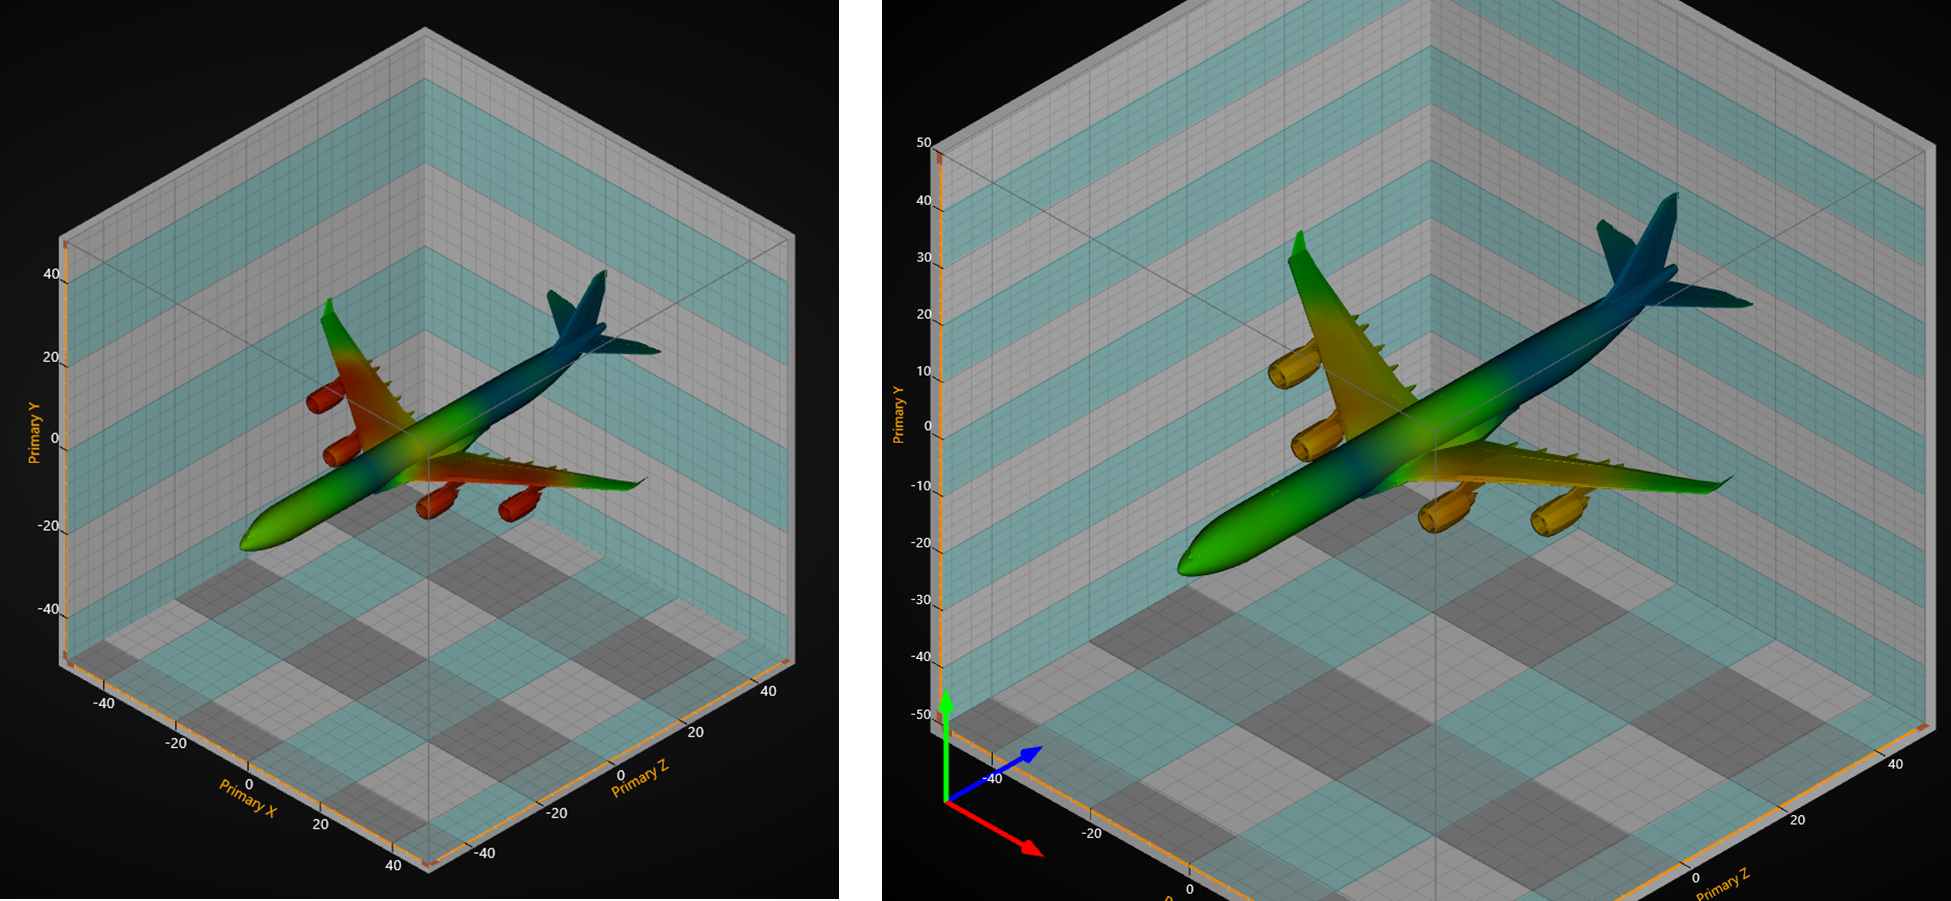
Orthographic projection type. On the left, unzoomed. On the right, zoomed in. Airplane (MeshModel3D) object size grows on the screen along with other objects.
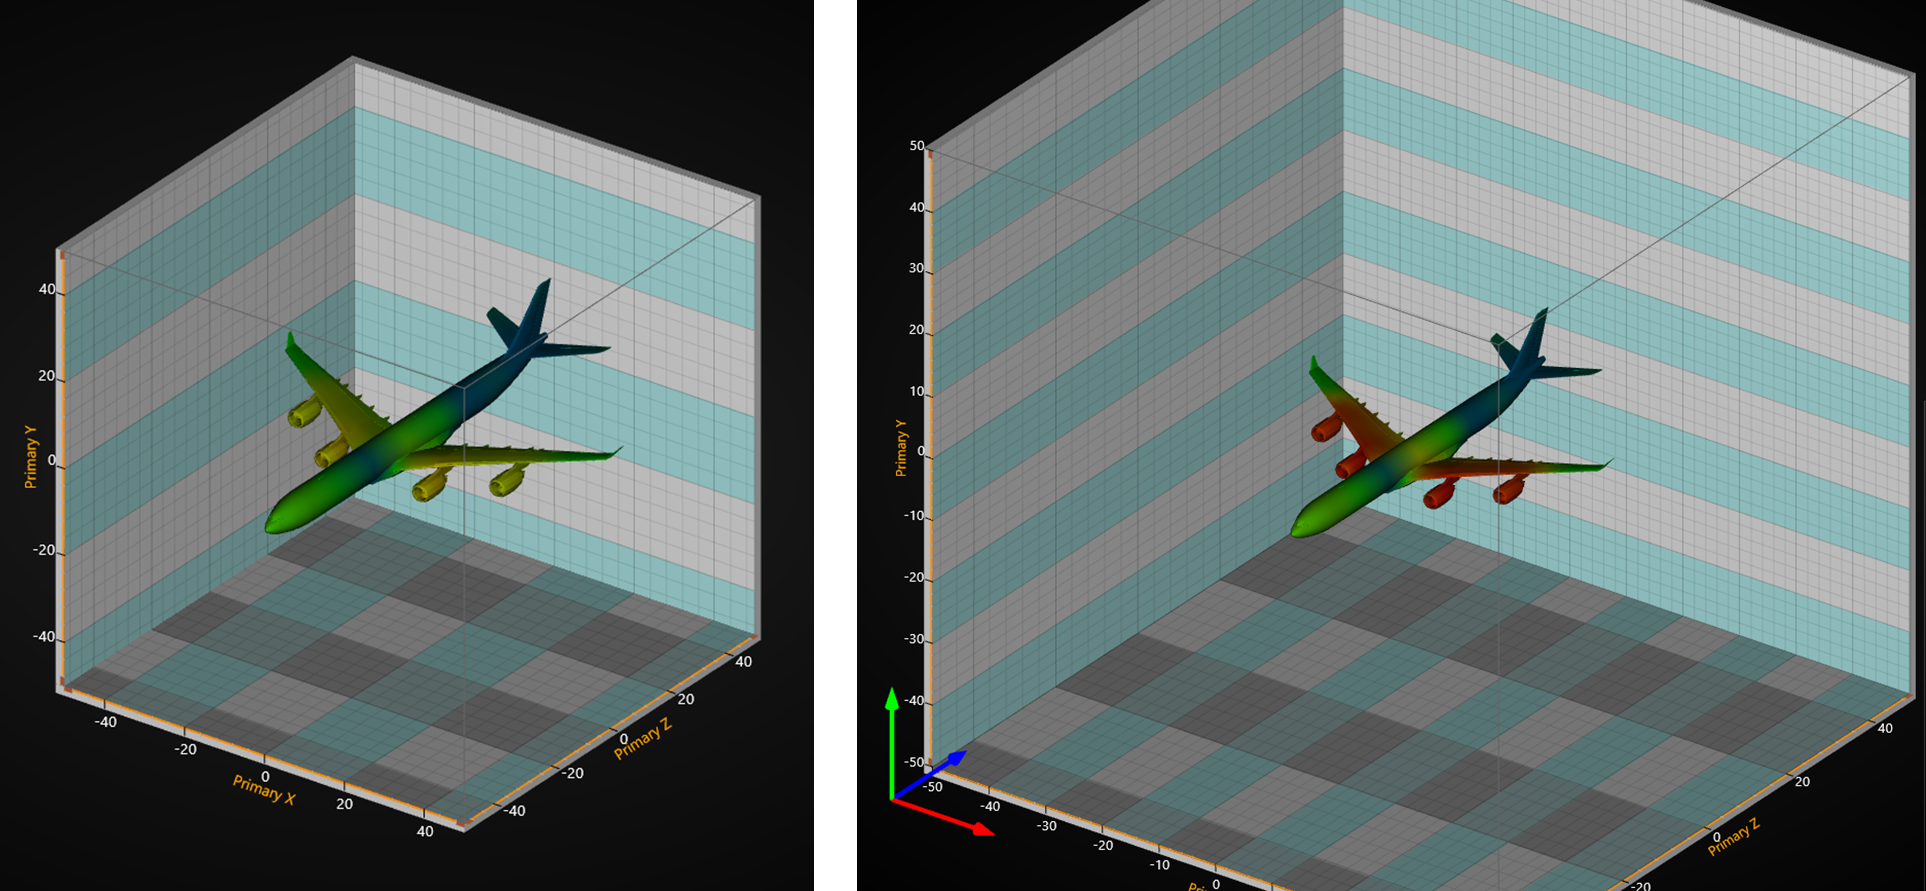
OrthographicLegacy. On the left, unzoomed. On the right, zoomed in. Airplane (MeshModel3D, see 7.14) object size stays the same, but 3D dimensions are changed.
Predefined cameras
Use SetPredefinedCamera method of View3D.Camera to set one of the predefined cameras.
// Setting predefined camera orientation
chart.View3D.Camera.SetPredefinedCamera(PredefinedCamera.BackOrthographic);
To see feature demonstration as example, check CamerasAndLights from our Demo.
Camera orientation mode
LightningChart v8.4 added a new camera orientation mode with improved camera orientation definition. The new mode called ZXY_Extrinsic (the name defines in which order the dimensions are calculated) is now set to be the default orientation mode. It fixes many rotation-based issues especially near the poles of the chart (i.e. camera on top of the chart). The old orientation mode, XYZ_Mixed, is still available but will most likely become deprecated at some point in the future. Orientations can be accessed via View3D.Camera. OrientationMode.
Rotations are also modified by this change. With the new camera orientation mode, one of the axis directions (world unit vectors) is used as the horizontal mouse rotation axis. This is the axis of which the camera is rotated around. Axis determination is automatically done when RotationX, RotationY or RotationZ properties are changed. Closest axis to the camera’s up direction is selected as the rotation axis, so that the rotations feel as natural as possible on all occasions.
The new orientation and rotation model allow views in the 3D scene that were previously impossible.
3D Lights
Lights can be freely positioned anywhere in the 3D model space. Several lights can be added into Lights collection property. There are two different light types: Directional and PointOfLight.

Directional light and point of light.
Some series types (SurfaceGridSeries3D, SurfaceMeshSeries3D, WaterfallSeries3D) allow suppressing lighting totally from its surface via SuppressLighting property. Check it’s not enabled if the series should be correctly lit. Surface series have LightedSurface property, which selects the surface side that is correctly lit.
Placing all the lights inside the 3D model box can make the wall edges appear very dark, possibly making axis ticks hardly visible. Adjust axis tick coloring in such case.
Directional light
In Directional (Type) light, the light rays are parallel, and the light intensity does not attenuate as the distance increases. The light flux gets direction from Location and Target properties. LocationFromCamera property allows using to the location of the camera as a source of light.
Point of light
In PointOfLight (Type) intensity attenuates as the distance grows. Use AttenuationConstant, AttenuationLinear and AttenuationQuadratic properties to control the attenuation over distance.
Target is irrelevant with this light type, as the light is distributed equally to all directions.
Lights and materials
All 3D objects have a Material property. Material tells how to react to lights. Material’s DiffuseColor reacts with DiffuseColor of a light. Material’s SpecularColor reacts with light’s SpecularColor. Diffuse color can be understood as a matter base color, while specular color is the color that reflects off the lit surface. Using high SpecularPower gives the object a metallic look.
Surface series have ColorSaturation property, valid range is 0…100%. High value boosts the surface fill colors and reduces the shading effect.
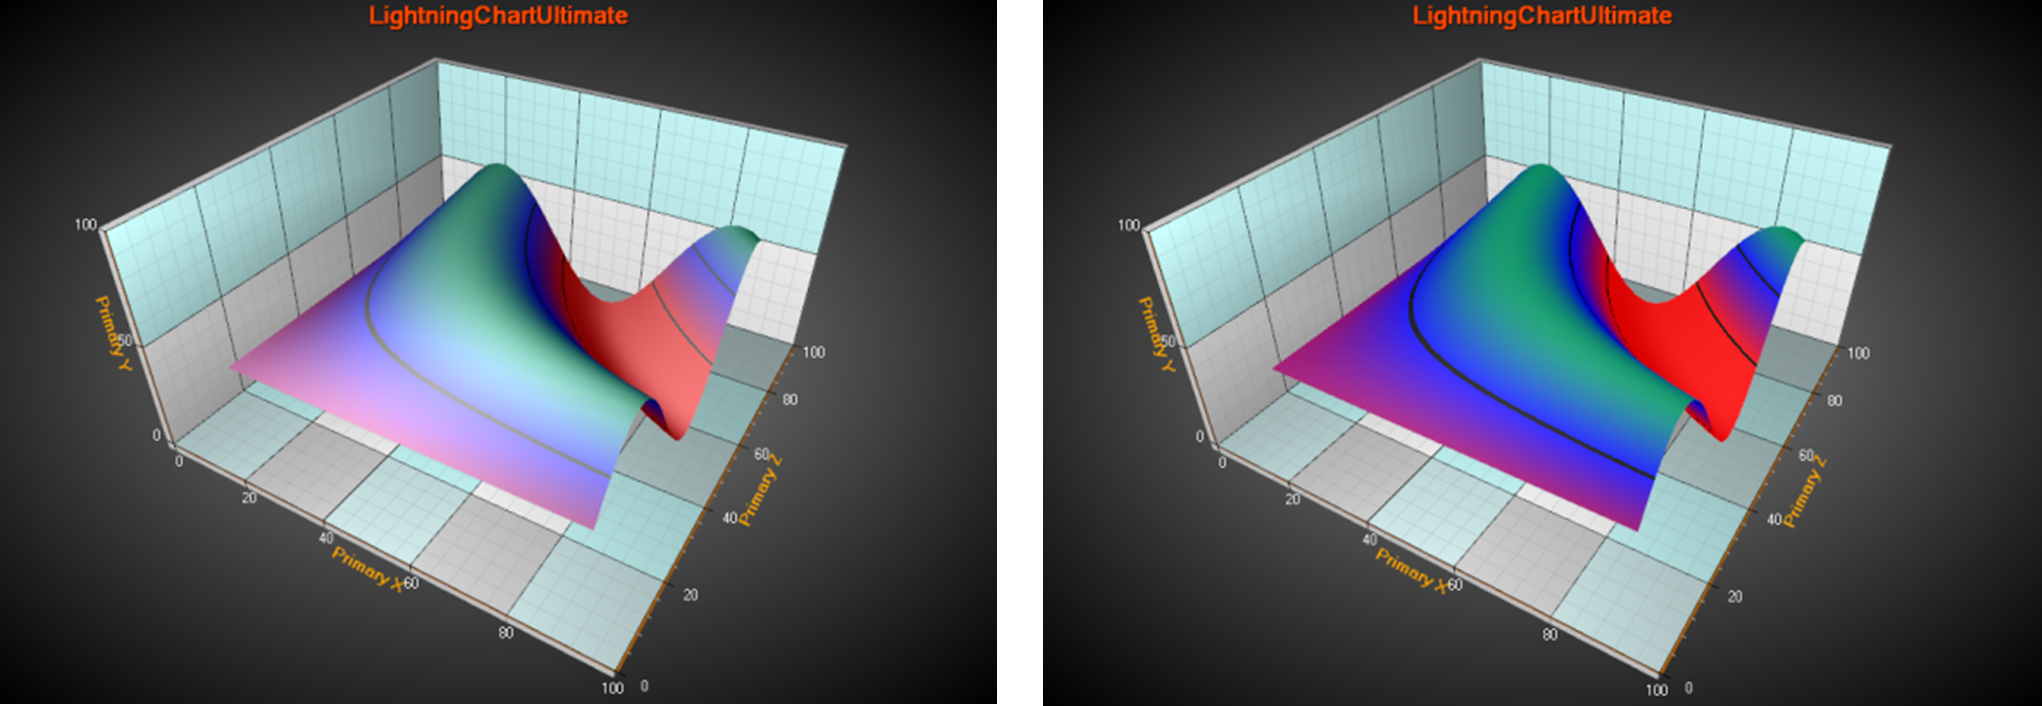
The surface series on the left has ColorSaturation = 50%. On the right, ColorSaturation = 85%.
Predefined lighting schemes
Use SetPredefinedLightingScheme method of View3D to select a built-in predefined lighting scheme.
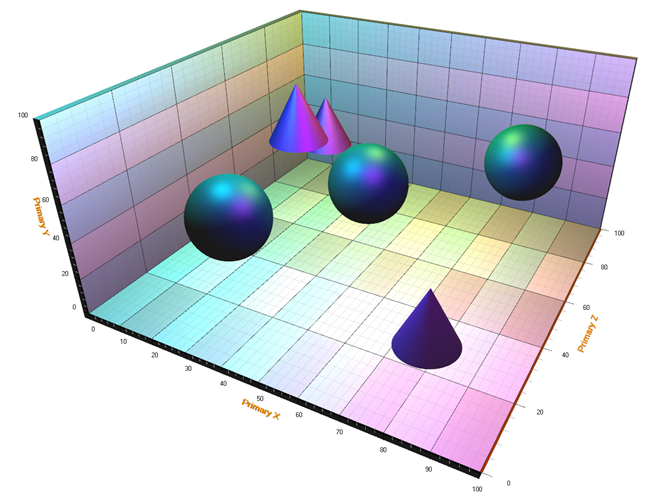
Predefined ‘DiscoCMY’ scheme in use. The scheme is composed from three differently colored PointOfLights near the ceiling. The spheres and cones are made with PointLineSeries3D.
To see feature demonstration as example, check CamerasAndLights from our Demo.
3D Axes
In general, the 3D axes behave very much like ViewXY’s axes. Many of the properties and methods are similar.
For each dimension, there are two axes: primary and secondary. In other words, View3D has the following axis properties available: XAxisPrimary3D, XAxisSecondary3D, YAxisPrimary3D, YAxisSecondary3D, ZAxisPrimary3D and ZAxisSecondary3D.
Location
The axes can be positioned in 3D model box corners. Use Location property of an axis to adjust the position.
- For X axis, the Location options are: BottomFront, BottomBack, TopFront and TopBack.
- For Y axis, the Location options are: FrontLeft, FrontRight, BackLeft and BackRight.
- For Z axis, the Location options are: BottomLeft, BottomRight, TopLeft and TopRight.
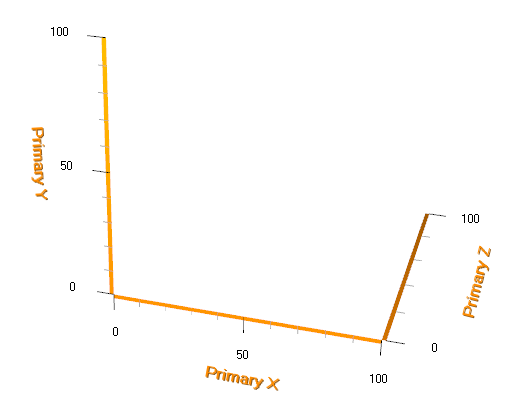
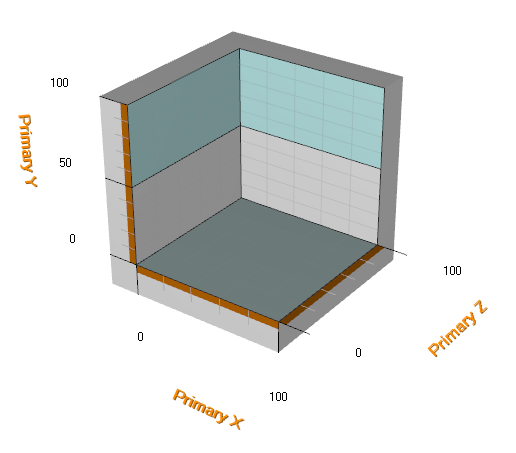
Default axis location setup, XAxisPrimary at BottomFront, YAxisPrimary at FrontLeft and ZAxisPrimary in BottomRight.
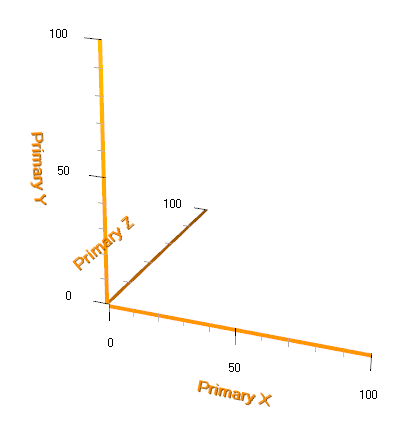
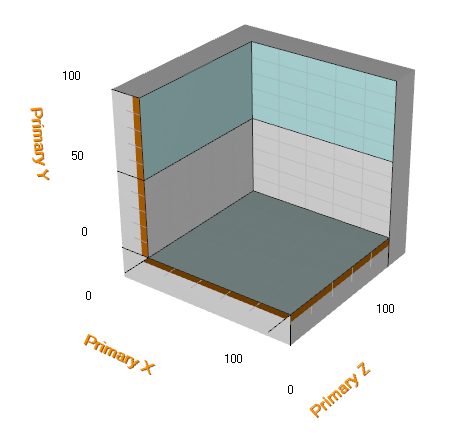
ZAxisPrimary location set to BottomLeft.
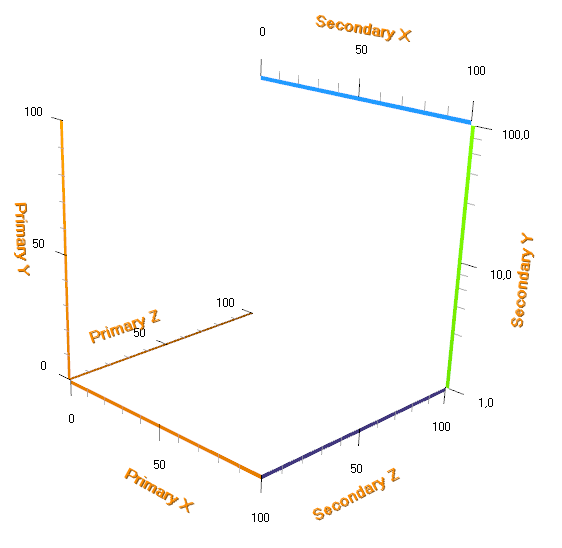
Secondary axes set visible, and their locations and colors set arbitrarily. Secondary Y axis ScaleType set to Logarithmic.
Orientation
Each axis can be oriented in two planes. This affects the position and orientation of both axis ticks and value labels.
- X axis: XY and XZ planes
- Y axis: XY and YZ planes
- Z axis: XZ and YZ planes
X axis orientation is set to XY, Y axis orientation to XY, Z axis orientation to XZ.
Y axis orientation stays same, but X axis orientation is changed to XZ and Z axis orientation is changed to ZY plane.
Changing Orientation maybe in particular useful when viewing 'from above'.
CornerAlignment
The axis alignment in 3D model box corners can be changed with CornerAlignment property.
Use MajorDivTickStyle and MinorDivTickStyle Alignment properties to control the text alignment.
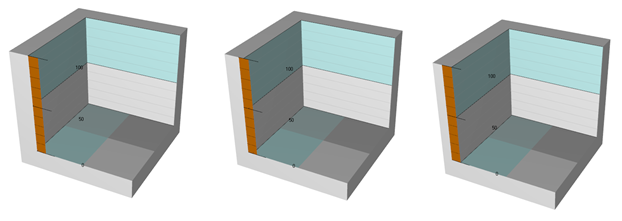
Only Y axis is visible in this example. First figure: Y Axis CornerAlignment is set to Inside. Alignment properties in MajorDivTickStyle and MinorDivTickStyle are set to Near. Second figure: CornerAlignment is set to AtCorner. Third picture: CornerAlignment is set to Outside.
3D Margins
From LightningChart v.8.4 onwards, View3D supports margins. Similarly to ViewXY, when AutoSizeMargins is set true, the graph size is adjusted so that there’s enough space for all the axes and chart title. If it is disabled, View3D. Margins property applies allowing setting margins manually. By default, AutoSizeMargins is set false.
View3D.MarginsChanged event can be set to trigger when a margin has been changed because of (for example) resizing it.
The contents of the view are automatically clipped outside the margins. All contents are clipped other than the chart title, annotations and legend boxes as their position is defined in screen coordinates, allowing them to be freely positioned on the margins as well. A one-pixel or more wide (Border. Width property from version 12.4) border rectangle, Border, can be drawn to display where the margins are. By default, the border is not visible in View3D (enable Visible property to see it). The color of the rectangle can be changed via Border.Color.
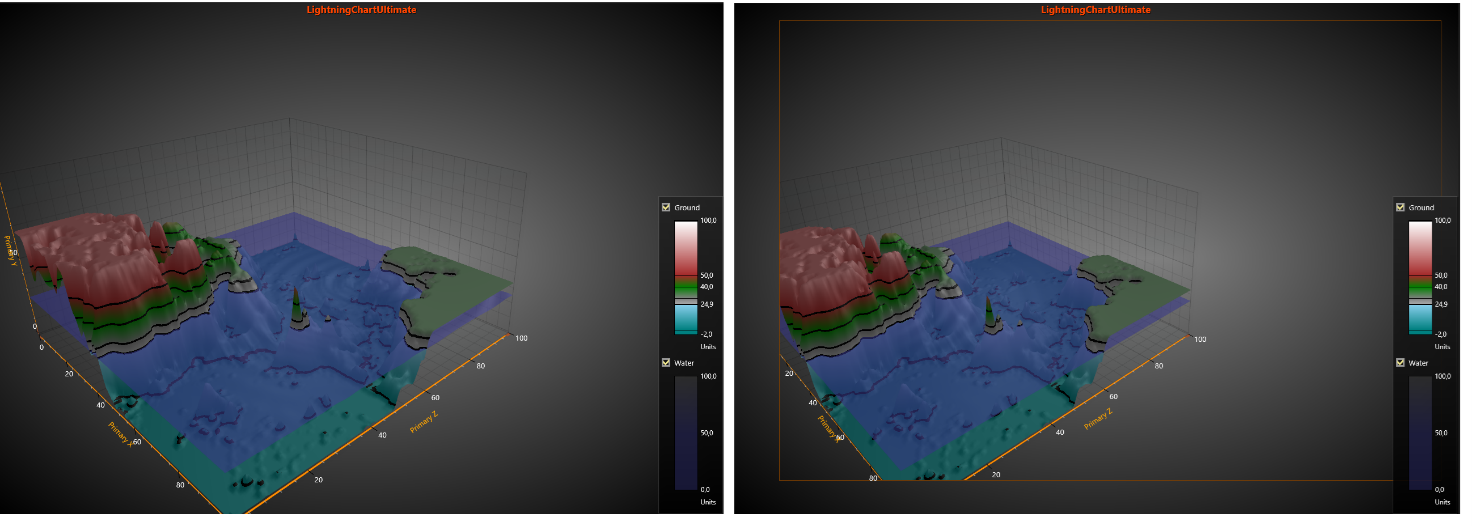
On the left, the graph has no margins (all margins set to 0). On the right, margins are set and the content is clipped outside them. Border.Visible is set True to mark where the margins of the view are.
3D series, general
View3D’s series allow data visualization in different ways and formats. All series are bound to axis value ranges. For each dimension, the series can be selected to bind to primary or secondary axis. Use Series XAxisBinding, YAxisBinding and ZAxisBinding properties to control that.
Clipping objects within axis ranges
By setting ClipContents property to True, series, rectangles and mesh models are clipped inside axis value ranges. The axes are always stretched for a dimension, so when clipping is enabled, it prevents rendering outside the walls.
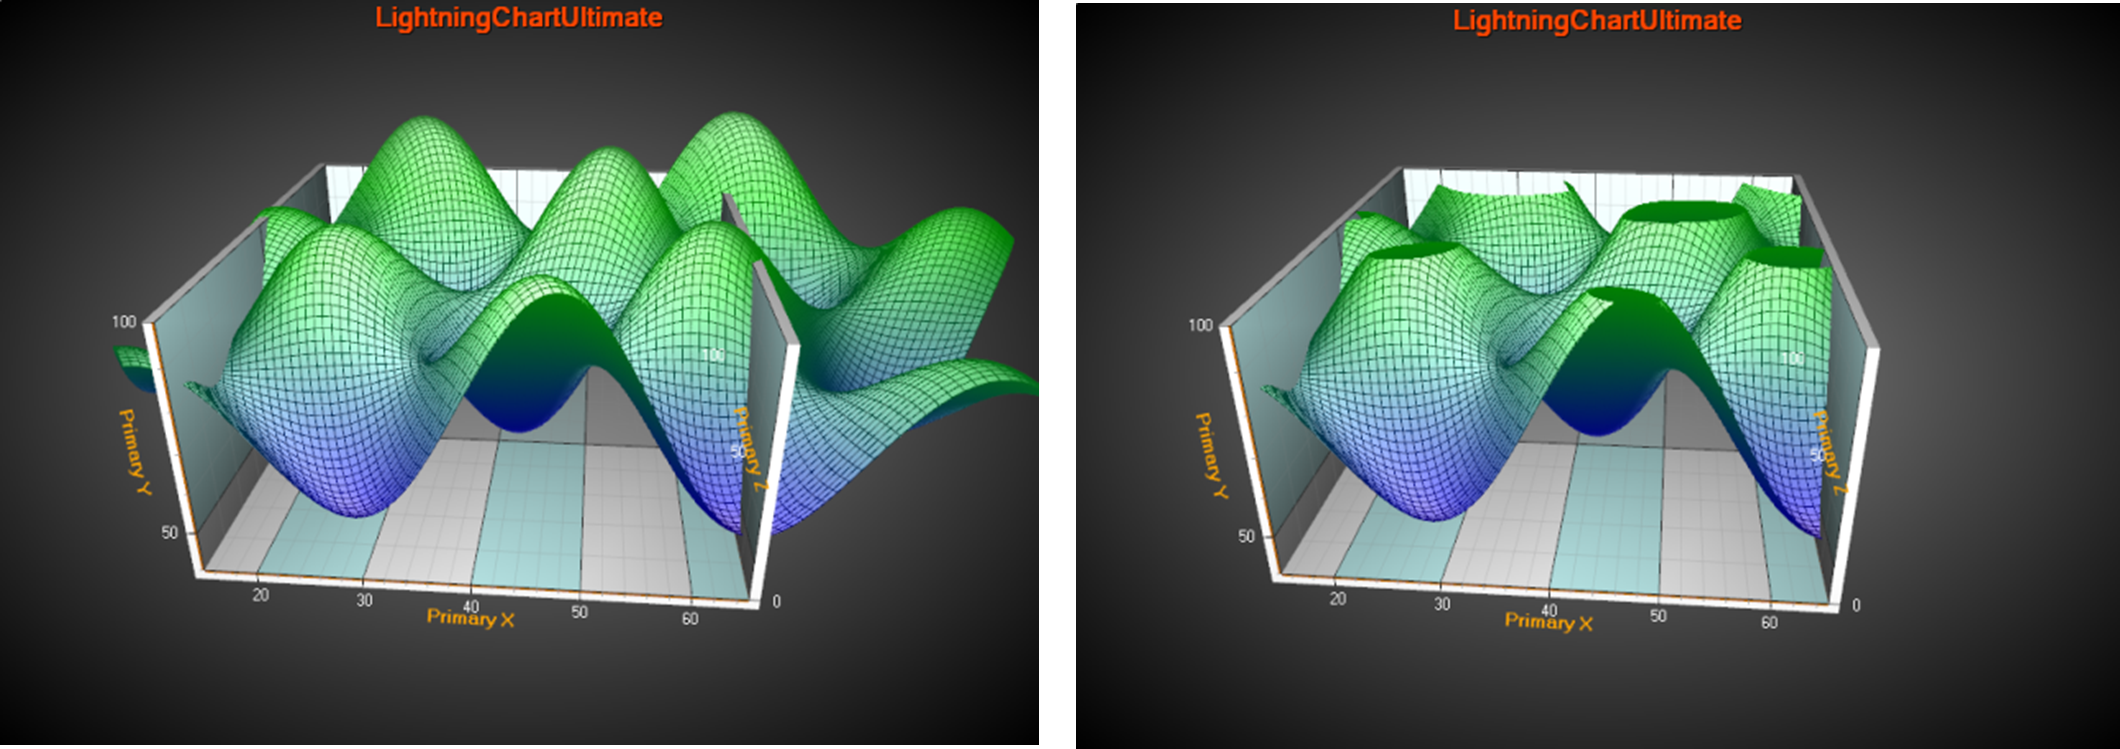
On the left, ClipContents is not used. Series render outside axis ranges. On the right, ClipContents is enabled.
Note that clipping does not modify the series data set itself. Clipping occurs only in rendering stage. Also, mouse hit test will take effect also outside the walls for invisible, clipped objects.