WaterfallSeries3D
With WaterfallSeries3D, the data is visualized in area strips. Areas can be filled, wire-framed and contour-lined like SurfaceGridSeries3D. In Y-dimension, area starts from BaseLevel property value. The node data can be set like in SurfaceMeshSeries3D.
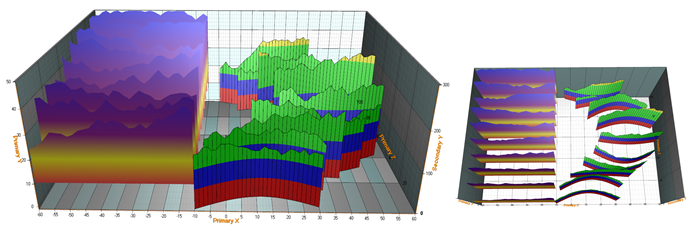
Two waterfall series. On the left violet series, X and Z are in rectangular form. BaseLevel = 10. On the right redgreen-blue series, X and Z values are bent, and each row is placed in different horizontal location.
WaterfallSeries3D is especially handy for presenting traditional 3D spectrum.
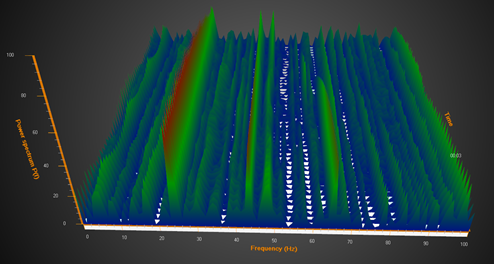
Waterfall series used for traditional spectrum presentation.
Examples
info
To see feature demonstration as example, check WaterFall3D, Spectrum3D and Spectrum3DWaterfall from our Demo.