3D model (MeshModel)
MeshModels list property allows inserting 3D models from external 3D model editors into LightningChart View3D. The models can be imported in OBJ format (Wavefront .obj file), which is a generic format in 3D modeling applications and game engines.
To see feature demonstration as example, check ExampleSeaMeshModels, ExampleMeshModelAsteroid, Airplane colored in real-time, Mesh models by code, EEG Visualization showcase, ExampleTranslucentChart3D from our Demo.

Battleship and submarine models loaded in View3D, over SurfaceGridSeries3D visualizing seabed depth data.
Loading a model
- To load a model from file, set the path and file name into ModelFileName property, or use LoadFromFile method. When loading the model from file, texture fills are loaded as well, if they exist in the same path, and MTL file and image files are accessible.
- Starting from LightningChart version 8.5, MeshModel creation supports colors for vertices in .obj -file. Vertex positions support Red, Green, Blue and Alpha values after x, y and z (XYZRGBA).
- To load model from stream, use LoadFromStream method. The stream reading method only reads geometry and materials, but not textures.
- To load model from a resource, use LoadFromResource method.
Constructing MeshModel programmatically from vertices
Starting from v.8.2, MeshModel supports constructing the 3D Model geometry programmatically. It allows visualizing objects and shapes that have been produced via computation (or parsed from other than OBJ files).
The following Create methods are available:
- Create(positions, colors, indices)
- Create(positions, colors, normals, indices)
- Create(positions, textureCoordinates, bitmap, textureWrapMode, indices)
- Create(positions, normals, textureCoordinates, bitmap, textureWrapMode, indices)
Index array (indices) parameters are optional. If provided, they will define which vertices, colors, light normals and texture coordinates to use from the arrays given. Using indices saves resources when same vertices are shared between multiple triangles.
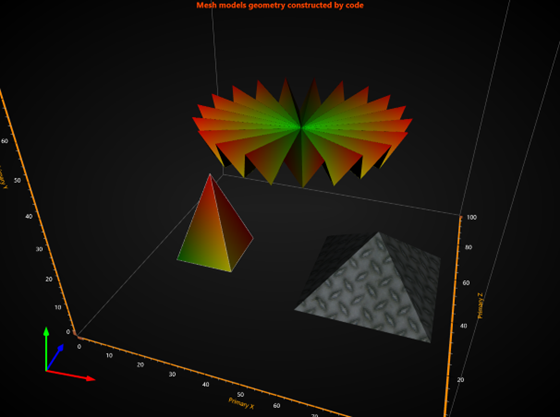
MeshModels constructed by code
The rotation, scaling and positioning properties etc., as well as events, apply also to a MeshModel created programmatically from vertices, in a similar way than they work for loaded objects.
An alternative way to create MeshModels is to use CreateFromTriangles() method. It creates the model based on the given arrays of vertices (PointFloat3D[]) and colors (Color[] or int[]), and an optional array of normal (PointFloat3D[]).
Positioning, scaling and rotating the model
A MeshModel object Position follows the X, Y and Z axes it has been assigned to. The model can be rotated by editing Rotation property. Size can be defined with Size property, which is a collection of factors for original model size and does not follow axis ranges or 3D world dimensions.
Only central point of mesh model is position at [x,y,z] axes values. The size of MeshModel is not fixed to Axes or Dimensions or 3D world. Therefore, one would need to scale model for the first time it is put on the chart. If user will change Axes range or 3D world dimensions, it will distort relative size of MeshModel.
NOTE! Zooming could be done with mouse wheel scrolling or changing Chart.View3D.Camera.ViewDistance property directly.
If user wants to change Axes range or dimensions after MeshModel is loaded, it is possible, but a bit more complicated (see How to resize MeshModel).
Enabling fill and wireframe
- To show fill, set property Fill = True
- To show wireframe, set property WireFrame = True, and set preferred line color in WireFrameLineColor.

Airplane shown as wireframe (WireFrameLineColor = Red) and with default gray fill.
Custom-coloring fill
By default, the model renders with the colors of the OBJ model. To apply custom coloring for model’s vertices, use UpdateFillColors(int[] colors) method. This method can also be called periodically, to apply real-time color updates. UpdateFillColors requires an ARGB colors array that is equal length of vertex positions (X.Length). One color for each vertex.
GeometryConstructed event reports position of vertices in axis values space, as X, Y and Z arrays. They are especially needed when applying coloring e.g. by spatial distance to other chart objects, such as data points. Subscribe to GeometryConstructed event handler in the initialization phase, and then unsubscribe when not needed anymore.

MeshModel colored by spatial distance utilizing UpdateFillColors method
ChartTools.ConvertDataToColorsByFixedIntervalPalette method can be utilized to convert data values into colors (ARGB int) by given palette steps.
Custom-coloring wireframe
Wireframe can also be colored with custom colors. Use GeometryConstructed event handler to get the required colors array length and UpdateWireframeColors method to apply the new colors.

MeshModel wireframe colored by spatial distance utilizing UpdateWireframeColors method
Updating the bitmap fill efficiently
When a MeshModel has been created by using Create method, supplying bitmap and texture coordinates as arguments, it is possible to update the bitmap very efficiently without reconstructing the geometry. Call UpdateFillBitmap method to update.

MeshModel with bitmap fill
UpdateFillBitmap method is not applicable for models loaded from OBJ files.
Reverse vertices winding order
Some models are made with reverse winding order and therefore culling makes them invisible. If the model does not show up correctly, change Cull setting to Clockwise, CounterClockwise or None.
meshModel.Cull = Cull.CounterClockwise;
Shade mode
It is possible to control whether lights affect MeshModel colors or not. By setting ShadeMode property to Flat, lighting has no effect on the model. By default, ShadeMode is set to Gouraud (lighting affects the model).
model.ShadeMode = ShadeMode.Flat;
By disabling lighting effects causes the model to lose some of its depth perception.
MeshModel rendering order
RenderingOrder -property was introduced in LightningChart version 8.5. It controls whether a MeshModel is rendered before (BeforeSeries options) other series, such as PointLineSeries3D and SurfaceGridSeries3D, or after them (AfterSeries options). MeshModels with similar RenderingOrder -settings are drawn in the order they are added to the chart.
meshModel.RenderingOrder = MeshModelRenderingOrder.BeforeSeries;
Above all RenderingOrder affects semi-transparent MeshModels. Its use is to determine if other series can be seen through the model. If a MeshModel uses no transparent colors, it blocks everything behind it from being seen regardless of RenderingOrder -settings.

RenderingOrder of a semi-tranparent MeshModel is set as BeforeSeries on the left and as AfterSeries on the right. With BeforeSeries -option, other series such as PointLineSeries3D cannot be seen through the model even if the model colors are transparent.
Note that currently Rectangles3D and Polygons3D are not affected by RenderingOrder as they are not considered series.
Tracing the model with mouse
MeshModel has triangle-based tracing for mouse position. Use TriangleTraced event, which indicates the nearest triangle to the camera and the mouse location.
The event arguments have the following info:
- IntersectionPointAxisValues: intersection point of triangle face in axes values;
- ModelSpaceTriangleCoordinates: array of 3 triangle corners (vertices) the mouse is hitting in 3D model space coordinates;
- WorldSpaceTriangleCoordinates: array of 3 triangle corners (vertices) the mouse is hitting in 3D world space coordinates;
- NearestCoordinateIndex: Index of nearest coordinate index of traced triangle, value of 0…2. Use the index to extract the coordinate from ModelSpaceTriangleCoordinates or WorldSpaceTriangleCoordinates array.

Tracing MeshModels with mouse. Traced result is shown in an Annotation.
Examples
To see feature demonstration as example, check SeaMeshModels, MeshModelAsteroid, MeshModelRealtimeColoring, MeshModelByCode and EEGDataVisualization from our Demo.