PointLineSeriesPolar
ViewPolar’s PointLineSeriesPolar can be used to draw a line, a group of points or a point-line. Add the series to chart by adding PointLineSeriesPolar objects to ViewPolar. PointLineSeries list.
Style
Lots of line and point styles are available in LineStyle and PointStyle properties. Those are identical to ViewXY line-series' LineStyle and PointStyle properties respectively.
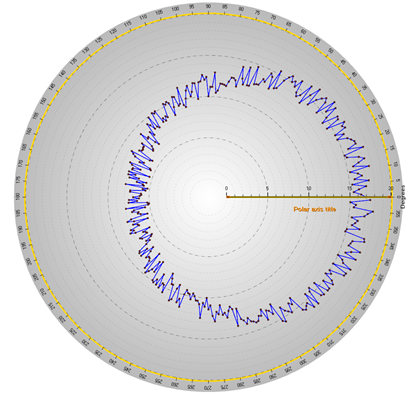
Some data presented with ViewPolar’s PointLineSeries. Line and points are both visible.
Setting data
The code represents the data setting of the previous figure.
int iCount = 360;
PolarSeriesPoint[] points = new PolarSeriesPoint[iCount];
Random rnd = new Random();

for (int i = 0; i < iCount; i++)
{
    points[i].Amplitude = 10.0 + 3.0 * rnd.NextDouble() + 5.0 *
            Math.Cos(AxisPolar.DegreesAsRadians((double)i * 1.0));
    points[i].Angle = (double)i;
}
chart.ViewPolar.PointLineSeries[0].Points = points;
A close look at the previous image reveals that the first and the last data points are not connected. PointLineSeriesPolar has ClosedLine -property which when enabled, automatically draws a line between these points.
// Connect the first and the last data point.
pointLineSeriesPolar.ClosedLine = true;
Palette coloring
Line coloring supports palette. ColorStyle property can be used to select how the palette coloring is applied.
- LineStyle: No palette fill. The color set in LineStyle.Color property applies.
- PalettedByAngle: Data point Angle field determines the color.
- PalettedByAmplitude: Data point Amplitude field determines the color.
- PalettedByValue: Data point Value field determines the color.
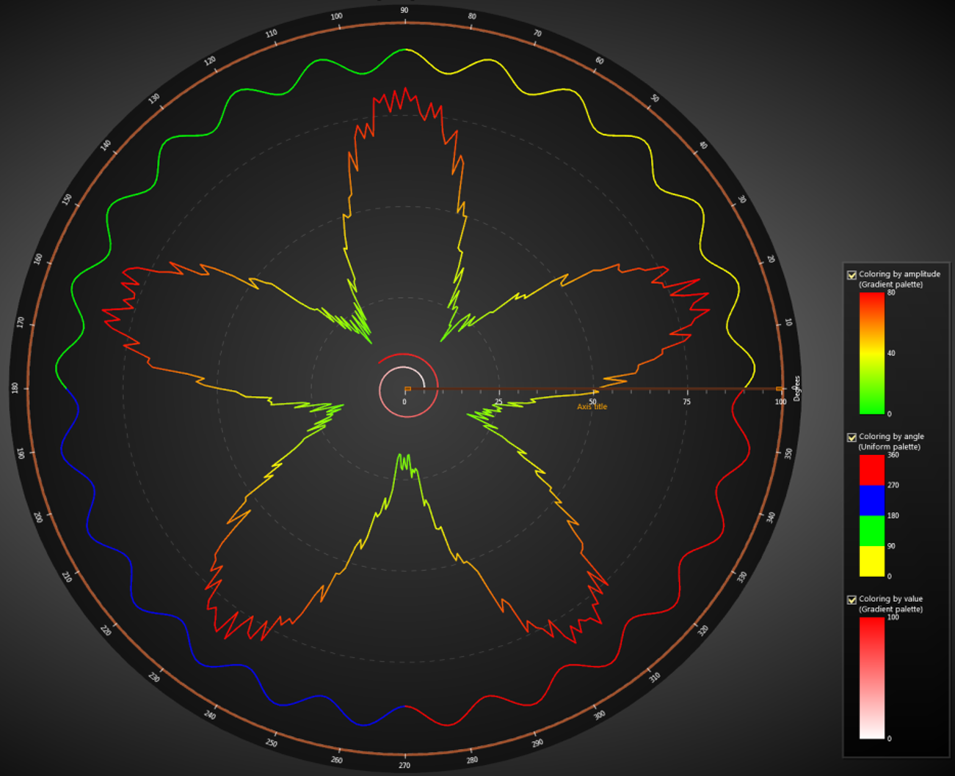
Palette coloring applied.
Use ValueRangePalette property to define the colors and value steps, it works similarly to ViewXY's and View3D's series (see ValueRangePalette).
CustomLinePointColoringAndShaping event
Custom coloring and coordinate adjustment can be made with CustomLinePointColoringAndShaping event, which is called just before entering the rendering stage of the chart. It works in similar way than the CustomLinePointColoringAndShaping event in ViewXY’s SampleDataSeries, PointLineSeries or FreeformPointLineSeries.
Examples
To see feature demonstration as example, check ExampleLineSeriesPolar, PolarLinePalette, ScatterPolarMouseSelecting and PolarLineMultiColored from our Demo.