Zooming and panning
ZoomPanOptions, ZoomCenter, ZoomScale properties and ZoomToFit() method can be used to control the zooming and panning behavior.
Zooming by code
Zooming can be applied by code, by setting ZoomCenter and ZoomScale properties. ZoomCenter is defined as relative X-Y ranges:
- X = -1: polar view's left edge at center of chart area
- X = 0: polar view's center at center of chart area
- X = 1: polar view's right edge at center of chart area
- Y = -1: polar view's bottom edge at center of chart area
- Y = 0: polar view's center at center of chart area
- Y = 1: polar view's top edge at center of chart area
ZoomScale is the magnifying factor. For example, value 2 makes the chart appear twice as large in both X (vertical) and Y (horizontal) direction compared to 1. When ZoomScale=1, the diameter of polar circle is equal to chart's width or height (depending which one is smallest).
Mouse-zooming features
Mouse-zooming features can be configured in ViewPolar. ZoomPanOptions property tree.
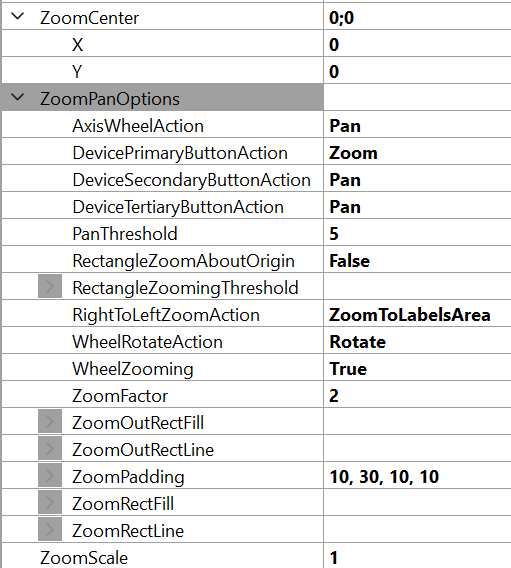
ViewPolar's ZoomPanOptions.
Zooming operations and methods
Various zooming operations under ZoomPanOptions can be set as mouse actions. For example, when properties DevicePrimaryButtonAction and/or DevicePrimaryButtonAction set for a Zoom option, the RightToLeftZoomAction property’s option DefaultSettings returns the initial zoom and centering settings. If RightToLeftZoomAction property’s option is ZoomToData (called FitView before v8.4), then action moves the viewpoint to show all data inside the margins. If RightToLeftZoomAction property’s option is ZoomToLabelsArea, action shows the whole data frame including labels inside the margins.
ViewPolar has the ZoomPanOptions. ZoomPadding property, which works similarly to View3D ZoomPadding.
The zooming operations can also be accessed in code as methods by using ZoomToFit() with ZoomAreaRound parameter (options are Data, LabelsArea and DefaultSettings). For instance, calling ZoomToFit(ZoomAreaRound.LabelsArea) method gets the same result as performing ZoomToLabelsArea operation via mouse action.
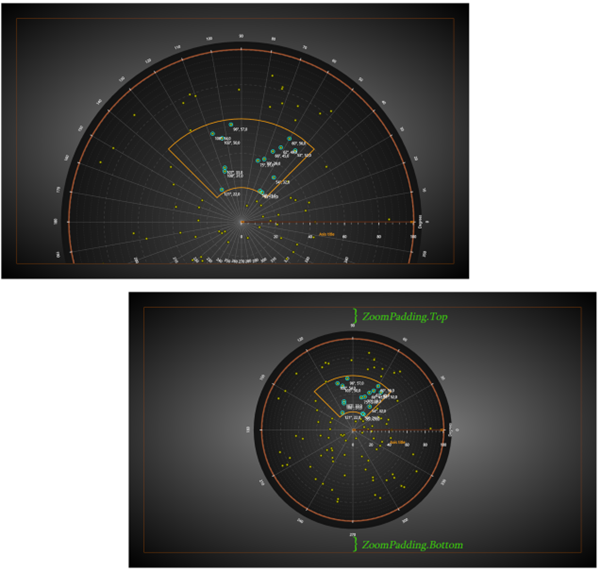
Polar chart before and after a zooming operation, ZoomPadding = 50. On top, the chart has been manually zoomed but no zoom operation has been called; ZoomPadding has no effect. Below, ZoomToLabelsArea was used, which also takes the labels into account when zooming.