AreaSeriesPolar
Area series allow data visualization in filled area style. The line style at the edge can be edited with LineStyle property (similar to ViewXY line-series' LineStyle). Fill can be changed with FillColor property.
Add the series to chart by adding AreaSeriesPolar objects to ViewPolar. AreaSeries list.
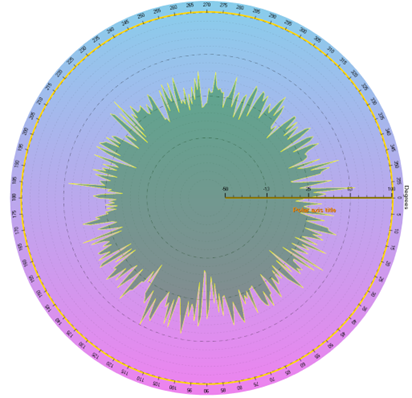
Some data presented with ViewPolar’s AreaSeries.
Setting data
This code represents the data setting of previous figure.
int iCount = 360;
PolarSeriesPoint[] points = new PolarSeriesPoint[iCount];
Random rnd = new Random();
for (int i = 0; i < iCount; i++)
{
    points [i].Amplitude = 30f + rnd.NextDouble() * 5f * Math.Sin((double)i / 50f);
    points [i].Angle = (double)i;
}
chart.ViewPolar.AreaSeries[0].Points = points;
Examples
info
To see feature demonstration as example, check ExampleAreaSeriesPolar, CombinedPolar, SpiderChart and Speedometer from our Demo.