ViewPolar overview
ViewPolar allows data visualization in a polar format. The data point position is determined by angular value and amplitude (compare angle as X and amplitude as Y in ViewXY). Polar view also has zooming and panning features.

ViewPolar object tree.
Axes
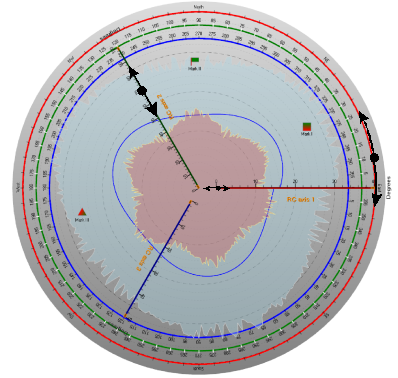
Three axes, the first one (red) in the outer circle, the second (green) in the middle, and the third (blue) closest to center. Axis AngleOrigin can be changed by dragging it over the axis circle. Amplitude range can be changed by dragging from the axis. Minimum or maximum of axis amplitude range can be changed by dragging from the small nib in the end of the amplitude scale.
Polar axes can be defined via Axes list property. Several axes can be used in same chart. Series can be assigned with any of these axes by setting AssignPolarAxisIndex property of a series. An axis represents both angular scale and amplitude scale. Otherwise, the polar axes are very similar to ViewXY axes.
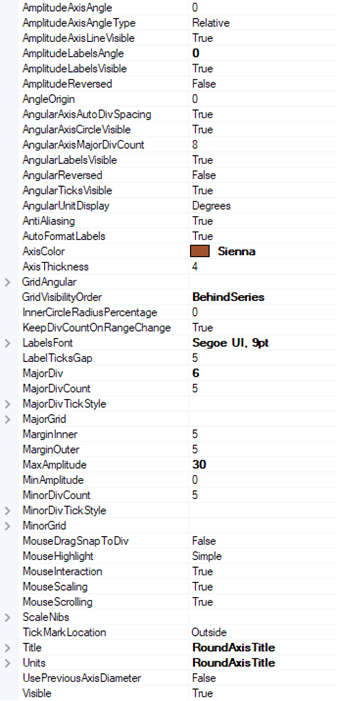
AxisPolar property tree.
Reversed axes
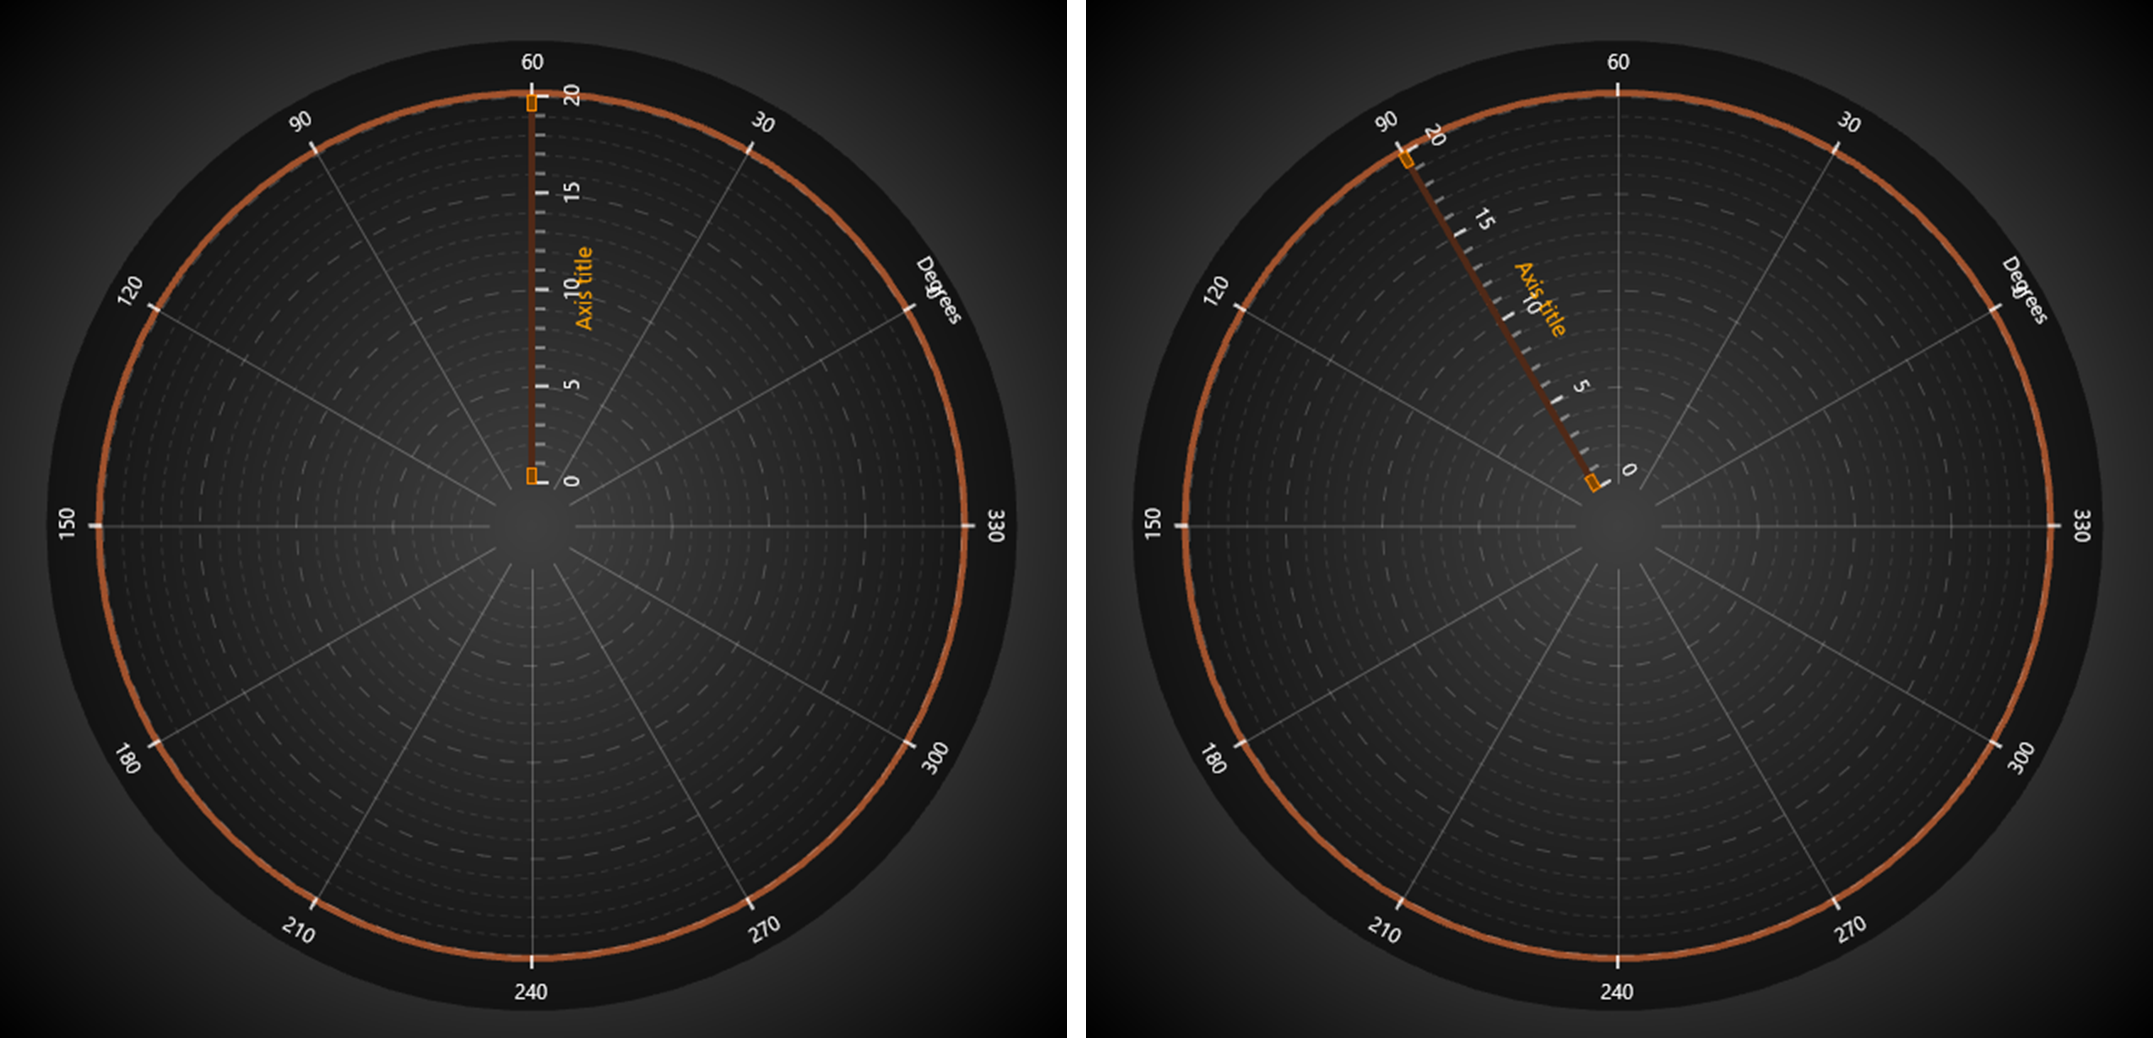
The axis can be reversed by amplitude, angle or both. To reverse the angle scale, set AngularReversed = True. To reverse the amplitude scale, set AmplitudeReversed = True.
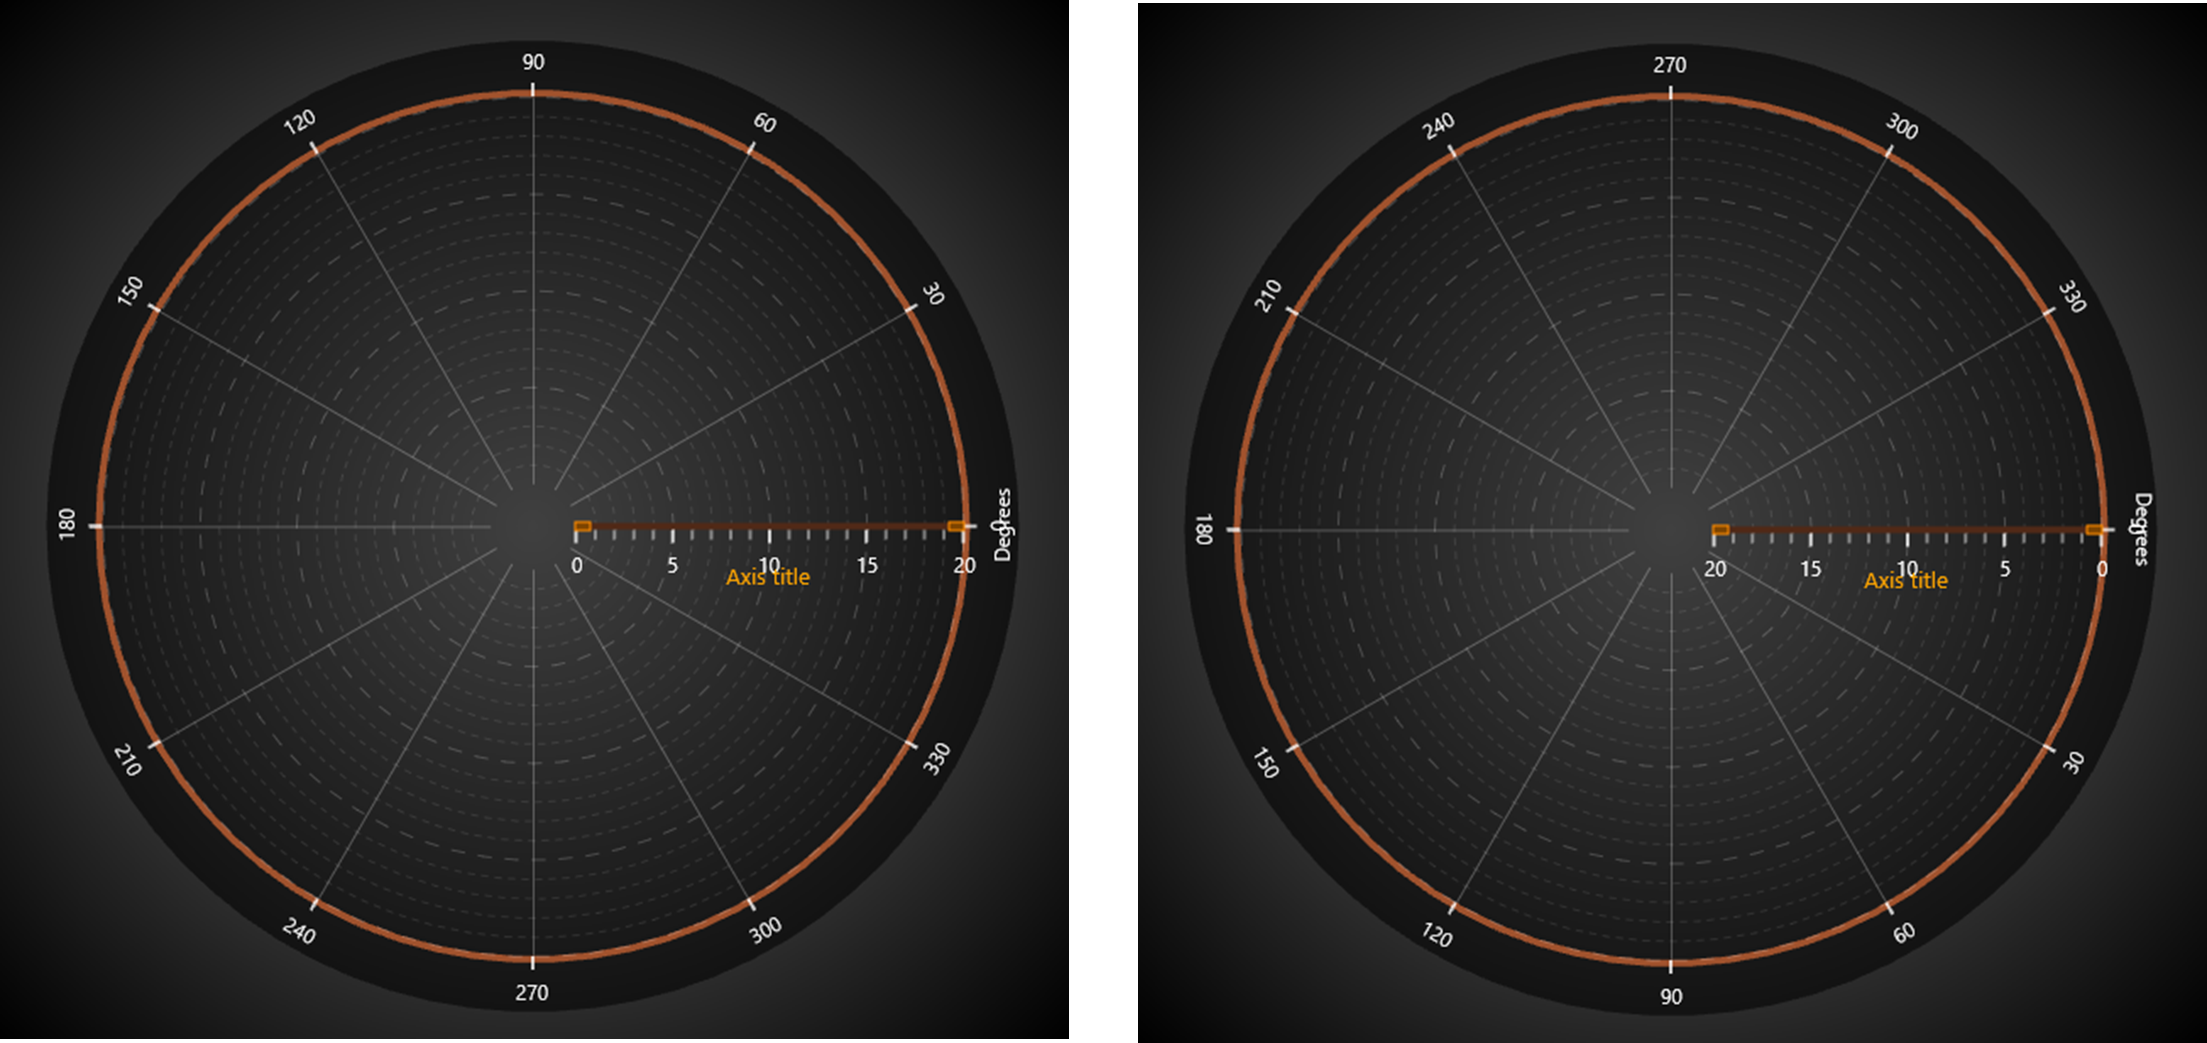
On the left, scales are not reversed. On the right, AngularReversed = True and AmplitudeReversed = True.
Setting rotation angles of the scales
Use AngleOrigin to set the rotation angle of angle scale.
AngleOrigin = 30.
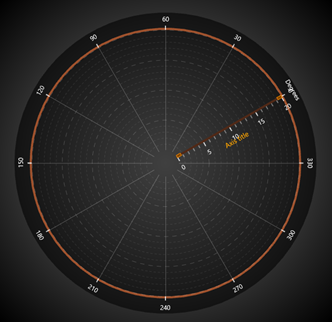
Use AmplitudeAxisAngle to rotate amplitude axis position. Amplitude scale angle can be set as absolute angle (AmplitudeAxisAngleType = Absolute), or relative (AmplitudeAxisAngleType = Relative) to angle scale’s angle.
AngleOrigin = 30. AmplitudeAxisAngle = 90. On the left, AmplitudeAxisAngleType = Absolute. On the right, AmplitudeAxisAngleType = Relative. Overall the amplitude scale rotates 120 degrees in this case.
Setting divisions
Set the amplitude division count with MajorDivCount, and division magnitude with MajorDiv property. The amplitude scale will adjust accordingly (updating MaxAmplitude). Set amplitude minor division count with MinorDivCount.
By default, the chart tries to include almost as many angular divisions as it can fit. To control the angular divisions, set AngularAxisAutoDivSpacing to False. Then the chart tries AngularAxisMajorDivCount count of divisions. If chart space is too small to render all the divisions and labels, it will use a lower division count that it can fit.
Margins
When AutoSizeMargins is enabled, the graph size is adjusted so that there’s enough space for all the axes and chart title. When it is disabled, ViewPolar. Margins property applies allowing setting margins manually.
In the run time, the margins rectangle can be retrieved in pixels by calling ViewPolar. GetMarginsRect() method, which applies to both automatic and manual margins. It is useful when needing to do screen-coordinate based computation or object placement.
ViewPolar. MarginsChanged event can be set to trigger when a margin rectangle has been changed because of for example resizing it.
The contents of the view are automatically clipped outside the margins. All contents are clipped other than the chart title, annotations and legend boxes as their position is defined in screen coordinates, allowing them to be freely positioned on the margins as well. A one or more pixel(s) wide border rectangle, Border. Width, can be drawn to display where the margins are. By default, the border is not visible in ViewPolar. The color of the rectangle can be changed via Border.Color property.
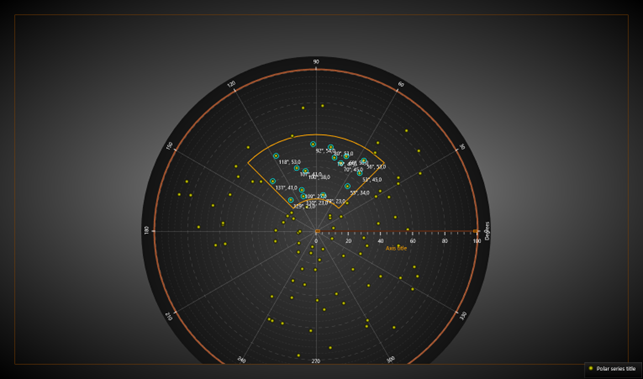
Contents of the polar chart are clipped outside the margins. Border is drawn to mark the margin area. Axis labels stay visible inside the borderline.