Point-Line
Point Line Series
Series for visualizing a collection of points and connected lines between them.


Creating Point Line series
series = chart.add_point_line_series()
Adding Data
There are many different ways you can add data to a Point Line series. The most basic way is to specify two lists of number values, one for X coordinates, and another for Y coordinates.
# Using x and y lists:
x_values = [0, 1, 2, 3]
y_values = [1, 3, 2, 4]
series.add(x_values, y_values)
Please refer to Adding Data to Charts section to see other available ways of adding data to a series.
Schema and Data Mapping
This section works the same as for Line, to avoid duplication of guides, please refer to the section under Line
Customizing Fill Coloring
Using Solid Point Color
import lightningchart as lc

series.set_point_color((255, 0, 0))
series.set_point_color('#FF0000')
series.set_point_color('red')
Using Solid Line Color
import lightningchart as lc

series.set_line_color((255, 0, 0))
series.set_line_color('#FF0000')
series.set_line_color('red')
Set Palette Coloring for Points
chart = lc.ChartXY(title='ChartXY', theme=lc.Themes.Light)
series = chart.add_point_line_series()


x_values = [0, 1, 2, 3]
y_values = [2, 3, 5, 7]
series.add(x_values, y_values)

# Define a palette for the point coloring to interpolate between red, yellow, and green:
series.set_palette_point_coloring(
    steps=[
        {'value': 2, 'color': '#FF0000', 'label': 'Min'},
        {'value': 4, 'color': (255, 255, 0)},
        {'value': 7, 'color': 'green', 'label': 'Max'},
    ],
    look_up_property='y',
    interpolate=True,
)

# With formatted legend display:
series.set_palette_point_coloring(
    steps=[
        {'value': 0, 'color': '#0000FF'},
        {'value': 100, 'color': '#FF0000'},
    ],
    look_up_property='value',
    formatter_precision=2,           # Decimal places
    formatter_unit='mag',             # Unit suffix
    formatter_scale=1.5,              # Scale values
    formatter_type='scientific',      # 'standard', 'compact', 'engineering', 'scientific'
    formatter_operation='floor',      # 'none', 'round', 'ceil', 'floor'
)


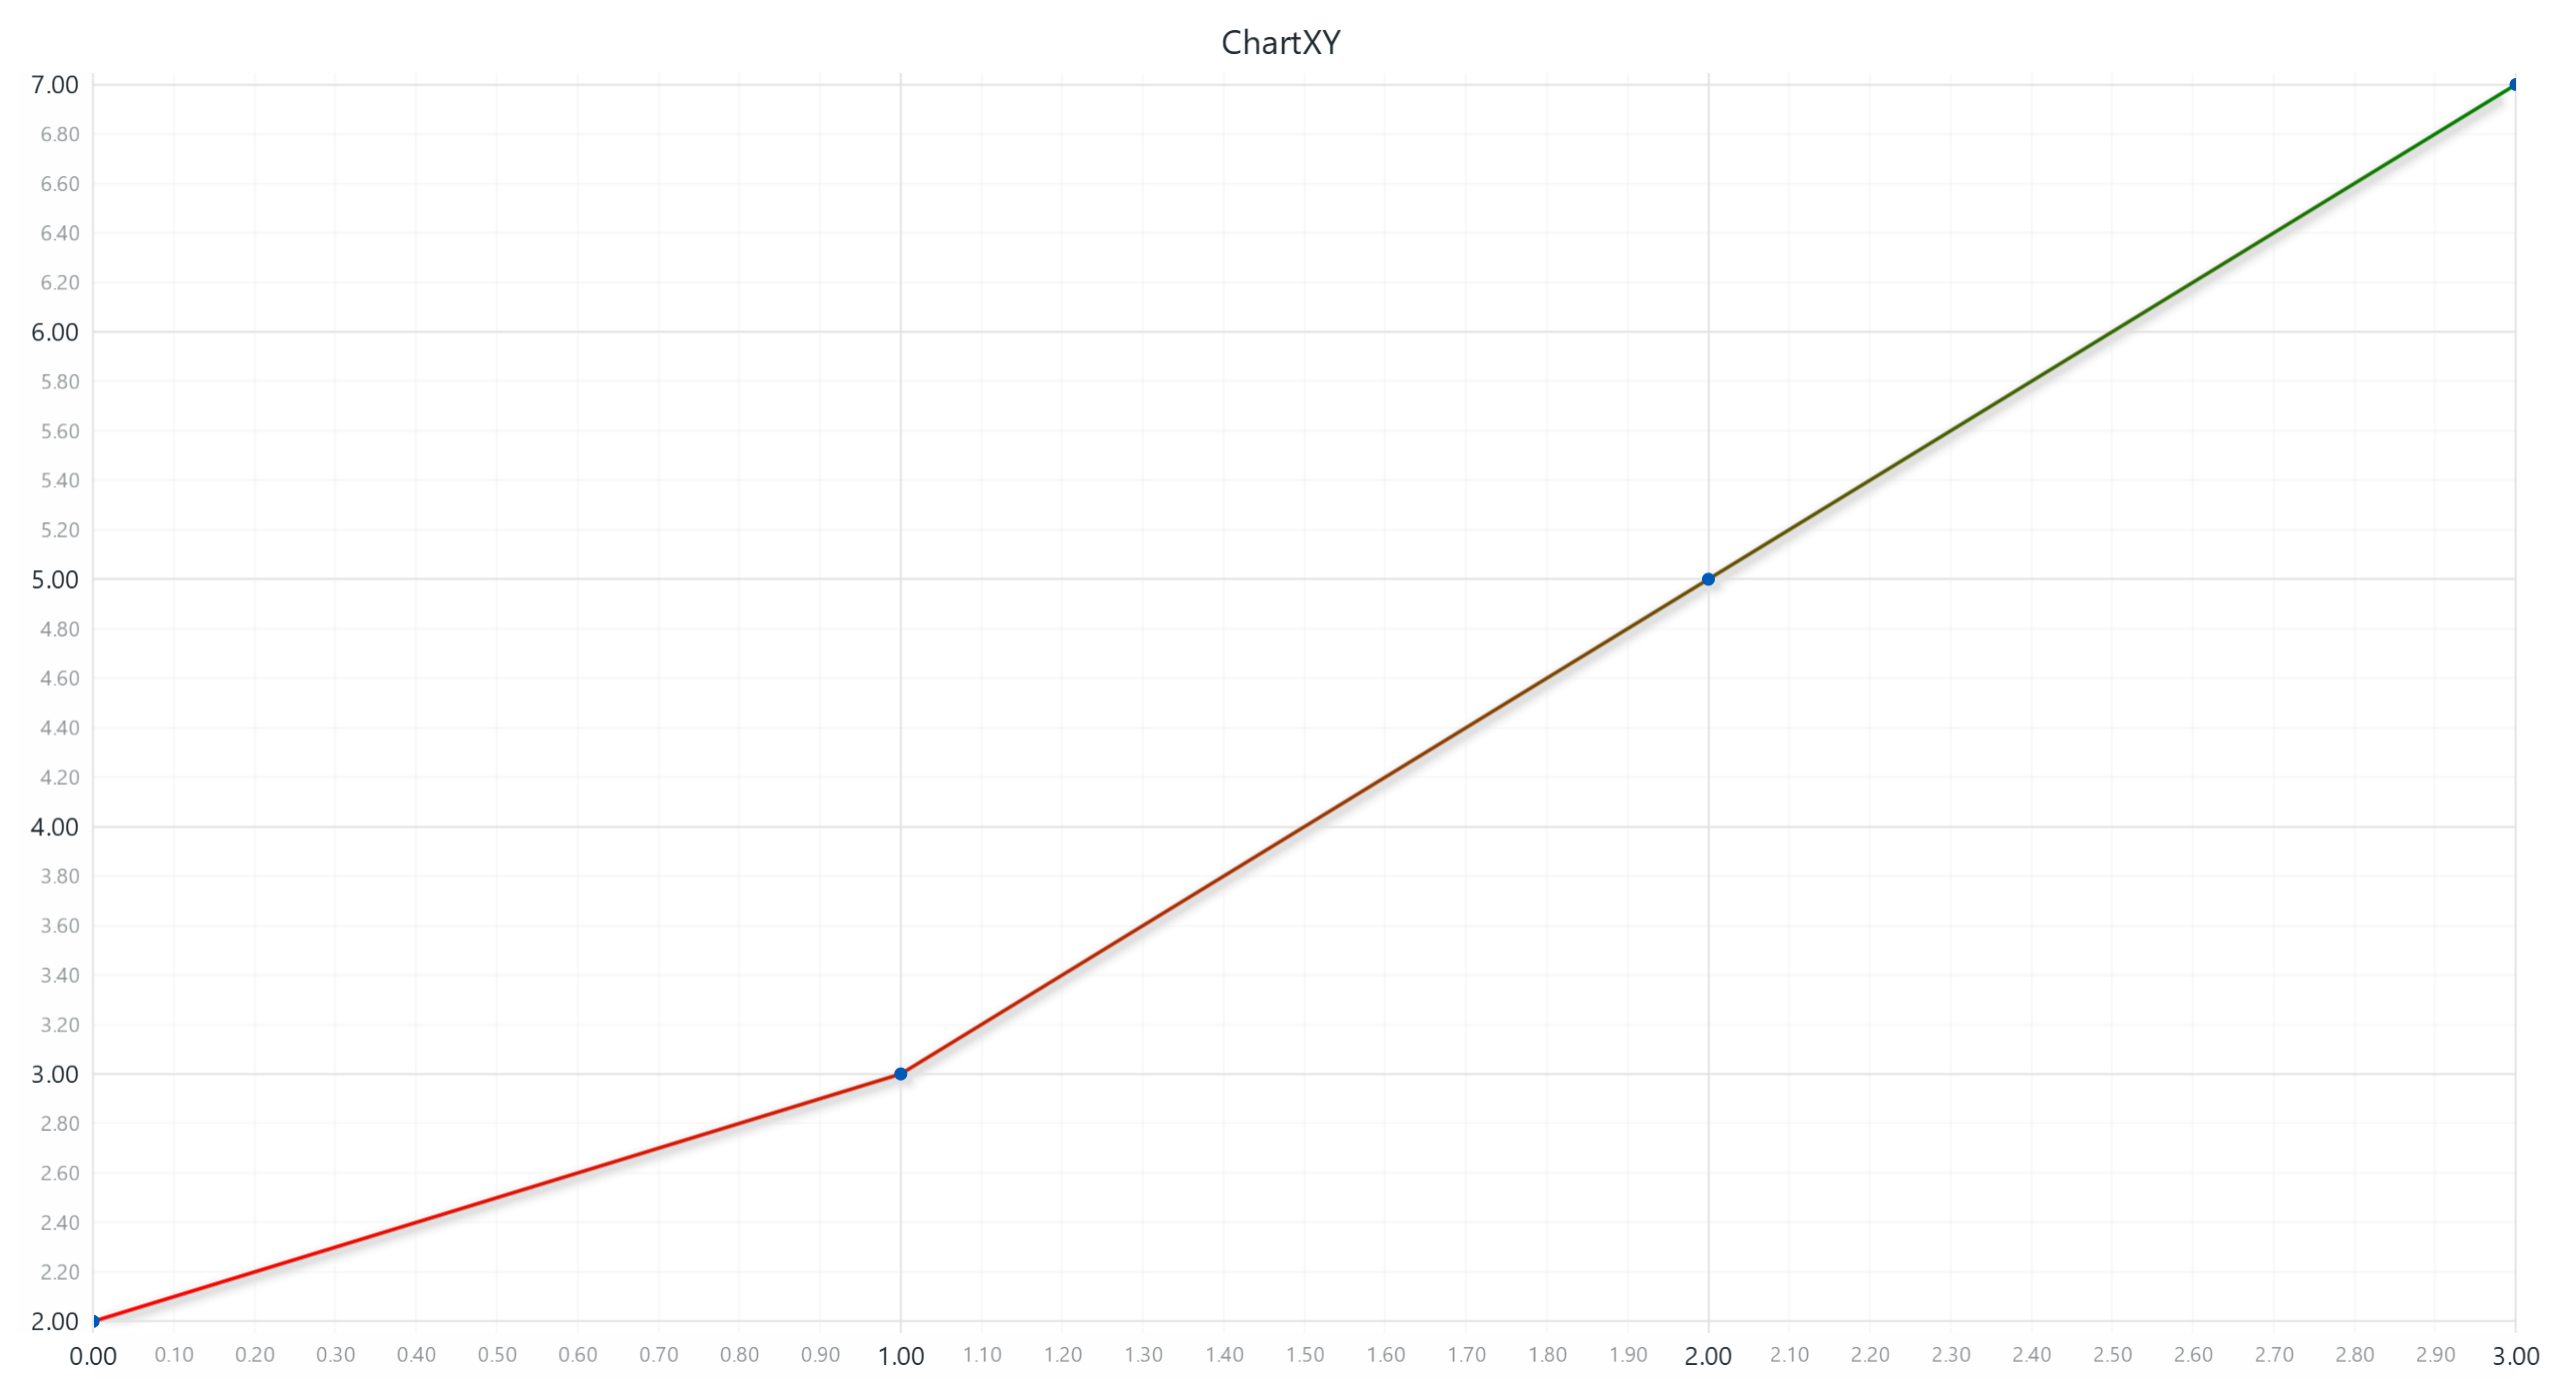
Set Palette Coloring for Lines
chart = lc.ChartXY(title='ChartXY', theme=lc.Themes.Light)
series = chart.add_point_line_series()


x_values = [0, 1, 2, 3]
y_values = [2, 3, 5, 7]
series.add(x_values, y_values)

# Define a palette for the line stroke to interpolate between red and green:
series.set_palette_line_coloring(
    steps=[
        {'value': 2, 'color': '#FF0000', 'label': 'Min'},
        {'value': 4, 'color': (255, 255, 0)},
        {'value': 7, 'color': 'green', 'label': 'Max'},
    ],
    look_up_property='y',
    interpolate=True,
)

# With formatted legend display:
series.set_palette_line_coloring(
    steps=[
        {'value': 0, 'color': '#0000FF'},
        {'value': 100, 'color': '#FF0000'},
    ],
    look_up_property='value',
    formatter_precision=2,           # Decimal places
    formatter_unit='mag',             # Unit suffix
    formatter_scale=1.5,              # Scale values
    formatter_type='scientific',      # 'standard', 'compact', 'engineering', 'scientific'
    formatter_operation='floor',      # 'none', 'round', 'ceil', 'floor'
)

Changing Line Thickness
series.set_line_thickness(5)
Changing Line Pattern
import lightningchart as lc

series.set_dashed(pattern="Dashed", thickness=3, color='#0000FF')
Available patterns include: "DashDotted", "Dashed", "DashedEqual", "DashedLoose", "Dotted", and "DottedDense".
Changing Point Shape
series.set_point_shape('circle')
Available patterns include: "arrow", "circle", "cross", "diamond", "minus", "plus", "square", "star" and "triangle".
Changing Point Stroke Style
series.set_point_stroke_style(style='solid', thickness=2, color="#ff0000")
Changing Point size
series.set_point_size(5)
Changing Point rotation
series.set_point_rotation(45)
Enabling or disabling individual point color attributes
series.set_individual_point_color_enabled(True)
Custom Point and Video Styling
These methods allow you to customize the appearance of points by using images or videos.
Set Point Image Style
Sets the fill style of points using an image. The image can be provided as a local file path or a URL.
# Use an image from a local file as the point style:
series.set_point_image_style("D:/path/to/local_image.png")

# Or use an image from a URL:
series.set_point_image_style("https://example.com/image.jpg")


Set Custom Point Shape
Allows setting a custom shape for points by using an icon.
# Use an icon from a local file as the point style:
series.set_custom_point_shape("D:/path/to/local_icon.png")

# Or use an icon from a URL:
series.set_custom_point_shape("https://example.com/icon.jpg")


Set Point Video Style
Sets the point fill style to a video.
# Set a video style for points using a local video file:
series.set_point_video_style("D:/path/to/local_video.mp4")

# Or use a video from a URL with a different fit mode:
series.set_point_video_style("https://example.com/video.mp4")
Series Utility Methods
This section works the same as for Line, to avoid duplication of guides, please refer to the section under Line
Legend
Please see common legend section.