Spider Chart
Chart for visualizing data in a radial form as dissected by named axes.
Spider Chart can have any number of Spider Series added to it using add_series.
Data can then be pushed in with add_points.
By default, Spider Chart automatically creates axes based on the data that are pushed to its series.
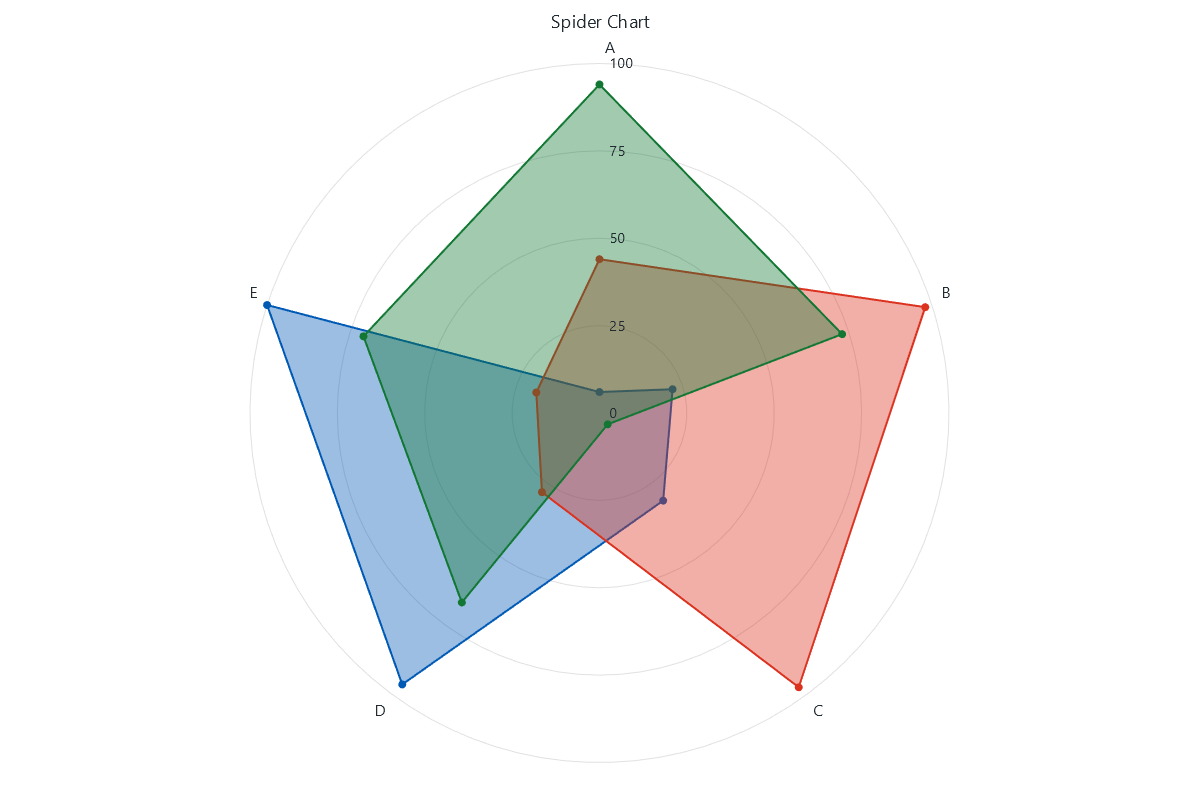
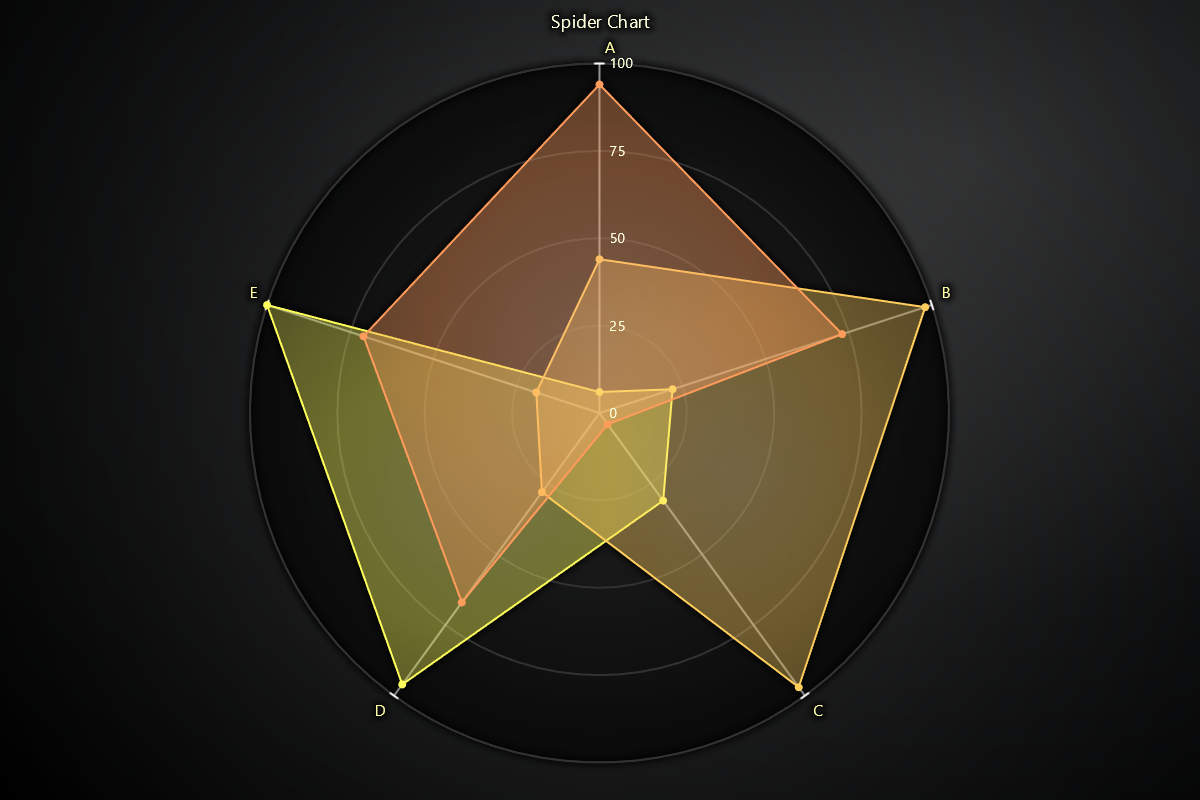
Creating Spider Chart
import lightningchart as lc

chart = lc.SpiderChart(theme=lc.Themes.Light, title='Spider Chart')
Appearance Customization
Customize the look and layout of your Spider Chart using the following methods.
Title
chart.set_title_color('#3498db')
chart.set_title_font(size=20, weight='bold')
chart.set_title_margin(10)
chart.set_title_rotation(0)
chart.set_title_effect(True)
Padding
Adjusts the space around the chart's plot area.
chart.set_padding(10)  # Uniform padding
chart.set_padding(left=10, top=15)  # Specific sides
chart.set_padding(left=10, top=15, right=20, bottom=25)  # All sides
Background Color
Sets the background fill color of the chart.
chart.set_background_color("#ffffff")
Background Stroke
Defines the border (stroke) around the chart's background.
chart.set_background_stroke(2, "#cccccc")
Axis Configuration
Configure axis intervals, labels, and visual styling.
Set Axis Interval
Control how far each axis extends.
chart.set_axis_interval(start=0, end=100)
Add Axis
Add a new named axis to the chart.
chart.add_axis("Speed")
Automatic Axis Creation
Enable or disable automatic axis creation based on data.
chart.set_auto_axis_creation(True)
Axis Label Styling
Customize label font, color, padding, and effects.
chart.set_axis_label_font(size=14, weight="bold")
chart.set_axis_label_color("#1414ca")
chart.set_axis_label_padding(6)
chart.set_axis_label_effect(True)
Axis Line Style
Customize axis line appearance.
chart.set_axis_style(thickness=2, color="#FF0000")
Axis Scroll Strategy
Define how the axis responds when new data is added.
chart.set_axis_scroll_strategy("fitting")
Scale Label Styling
Control scale tick labels on each axis (font, color, and padding).
chart.set_scale_label_font(size=12, style="italic")
chart.set_scale_label_color("#FF0000")
chart.set_scale_label_padding(4)
Disable/Enable animations
# To disable or enable all animations of the Chart
chart.set_animations_enabled(True)
Working with Series
Each Spider Chart can contain multiple series. Start by adding a series:
series = chart.add_series()
Coordinate Transformation
Convert between screen and chart-relative coordinates for positioning and interaction handling.
# Client to relative (auto-detect)
relative = chart.translate_coordinate(
    {'clientX': 500, 'clientY': 300},
    target='relative'
)

# Relative to client
client = chart.translate_coordinate(
    {'x': 400, 'y': 250},
    target='client',
    source='relative'
)
- relative: Pixels from chart edges
- client: Browser viewport pixels
Add Data Points
Add one or more data points to the series, where each point targets a specific axis.
series.add_points([
  {"axis": "Speed", "value": 90},
  {"axis": "Agility", "value": 70},
  {"axis": "Strength", "value": 85},
])
Series Fill Color
Set the fill color of the polygon area for the series.
series.set_fill_color("#8e44ad")
Series Line Color & Thickness
Customize the border line color and thickness around the series.
series.set_line_color("#2c3e50")
series.set_line_thickness(2)
Series Point Styling
Set visual style for data points on the series.
series.set_point_color("#e67e22")
series.set_point_size(6)
Series Utility Methods
# Set a name for the series (used in legend and tooltip)
series.set_name("Spider Series")

# Highlight the series fully (1.0 = max highlight)
series.set_highlight(1.0)

# Enable or disable whether this series participates in cursor pick events
series.set_cursor_enabled(False)

# Enable or disable theme-based visual effects
series.set_effect(True)

# Toggle series visibility (False hides it from view)
series.set_visible(True)

# Permanently remove the series from the chart
series.dispose()
Add TextBox
Please see common TextBox section.
Cursors
Please see common Cursors section.
Legend
Please see common legend section.
Radar Chart
Spider Chart can also be used to create a Radar Chart, by setting chart.set_web_mode("circle"). Every method available on the Spider Chart works identically in Radar Chart.

