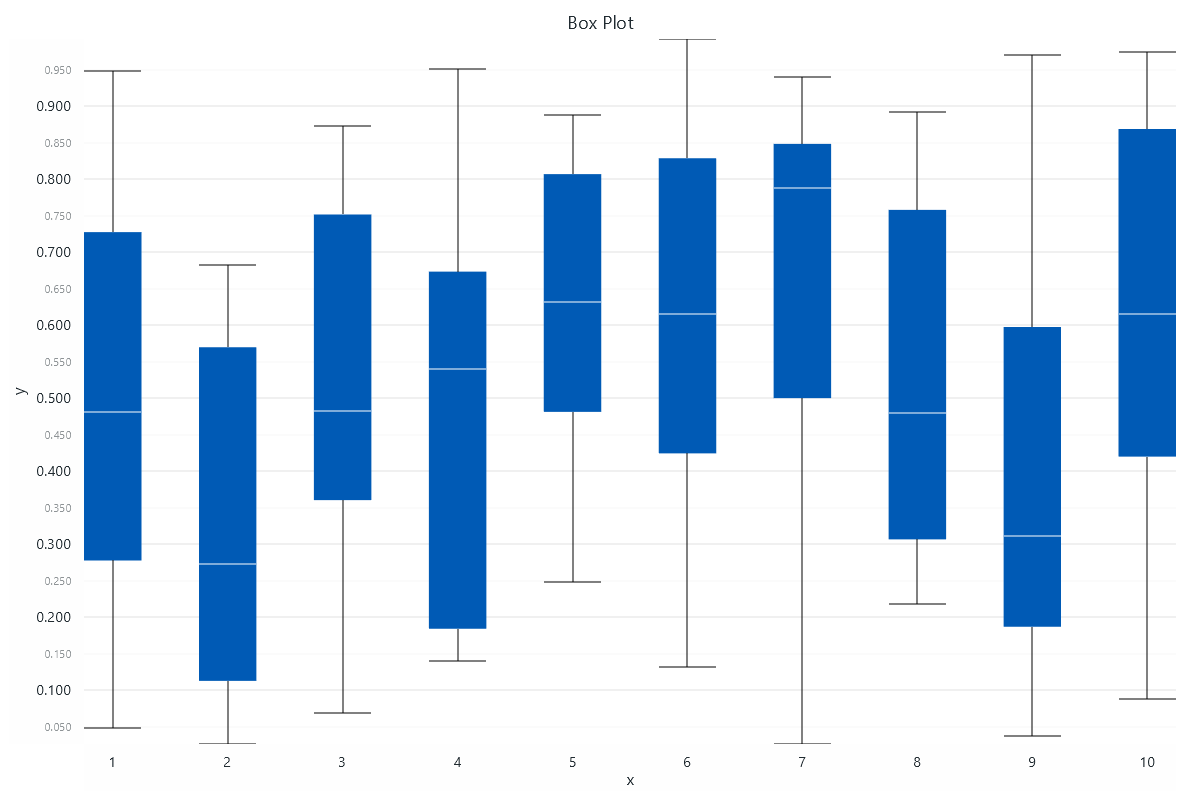
Box Plot (Box and whiskers)
Box plots can be created using ChartXY and Box Series.

Creating Box Series
box_series = chart.add_box_series()
Adding Data
Use add() to insert a single box figure, or add_multiple() to batch add figures.
box_series.add(
    start=1, end=2,
    median=5,
    lower_quartile=3, upper_quartile=7,
    lower_extreme=1, upper_extreme=9
)
box_series.add_multiple([
  {
    'start': 1, 'end': 2,
    'median': 5,
    'lowerQuartile': 3,
    'upperQuartile': 7,
    'lowerExtreme': 1,
    'upperExtreme': 9,
  },
])
Hover Effects
Toggle hover-based highlight effect:
box_series.set_highlight_on_hover(True)
Customizing Individual Boxes
For each box you can customize:
Appearance
box = box_series.add(
    start=1, end=2,
    median=5,
    lower_quartile=3, upper_quartile=7,
    lower_extreme=1, upper_extreme=9
)

box.set_visible(True)
box.set_body_color('#a63535')  # Fill color of box
box.set_body_width(0.8)  # Box width
box.set_tail_width(0.4)  # Whisker width
Strokes and Outlines
box.set_stroke(thickness=3, color='#954646')   # for tails/whiskers
box.set_body_stroke(thickness=3, color=(0, 0, 255))      # border around box
box.set_median_stroke(thickness=3, color='green') # line at median


Series Utility Methods
This section works the same as for Line, to avoid duplication of guides, please refer to the section under Line
Legend
Please see common legend section.