ViewSmith overview
Smith charts are generally used in electronics in impedance measurements and impedance matching applications.
Smith chart plots the data in real and imaginary values (R + jX).

Data position is determined on 2D-plot by angular on circular Real and Imaginary log-log scales.
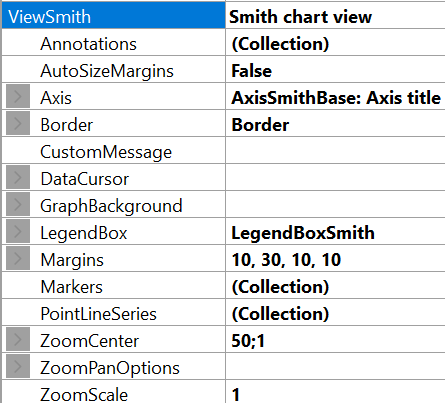
ViewSmith property tree.
Axis
The Smith chart has only one real axis, which can be configured via extended property tree Axis, see figure below.
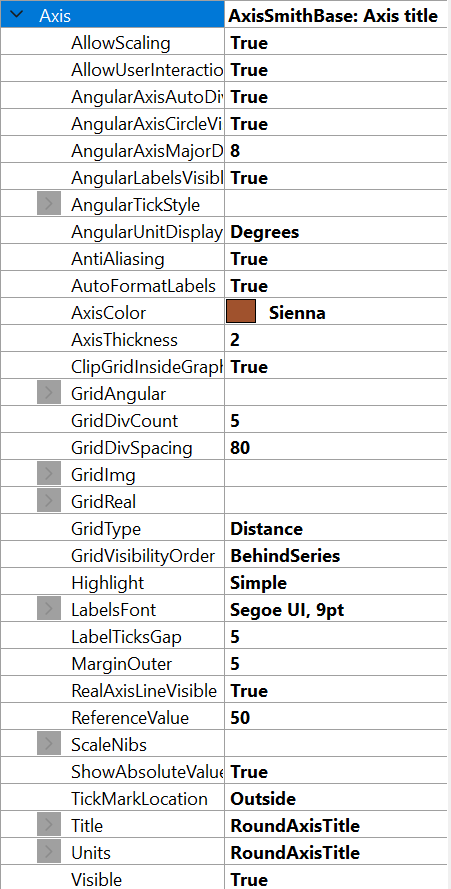
Smith axis property tree.
Most of the properties are identical to ViewPolar's axes and ViewXY's axes to customize and make the chart more attractive. There are also advanced properties specific to ViewSmith adjustment, e.g. GridDivCount, GridImg and GridReal, RealAxisLineVisible, ShowAbsoluteValues, ClipGridInsideGraph.
When GridType property set as DivCount, GridDivCount defines the amount of circular grid lines on Real Axes and logarithmic grid lines on Imaginary scale. In contrast, when GridType property set as Distance, GridDivSpacing property controls the position of those line.
GridImg and GridReal properties are responsible for customizing the grid lines either on Real or Imaginary scales. In addition, Visible property can be used to hide the grid, thus a user may hide one of them and continue to work with another. RealAxisLineVisible property hides the axis line.
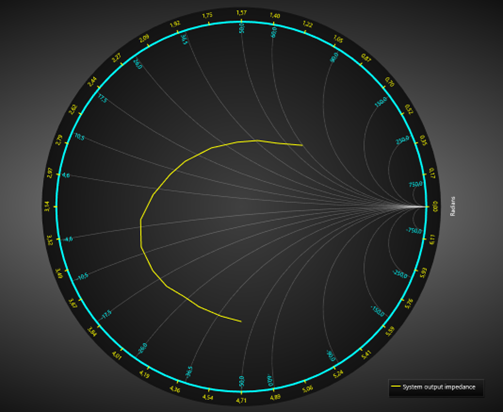
Real grid lines are hidden, Imaginary lines are visible.
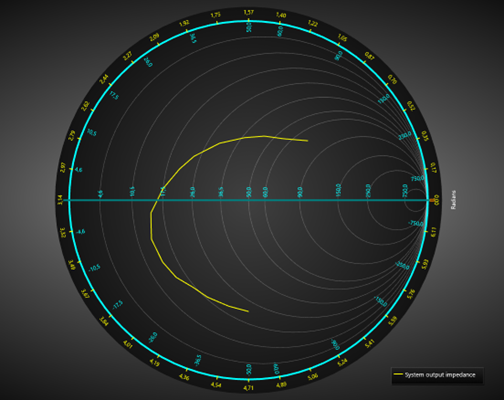
Imaginary grid lines are hidden, real lines are visible.
ShowAbsoluteValues property defines which values will be on scales (absolute or normalized).
Disabling ClipGridInsideGraph makes the grid-lines visible outside the chart circle.
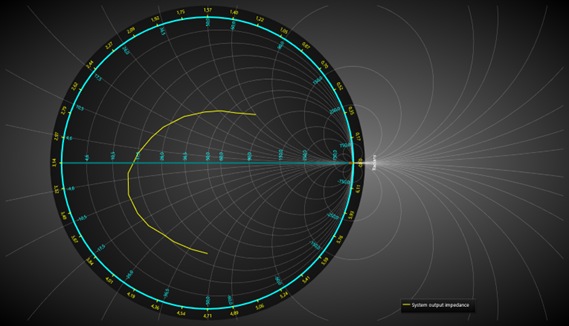
ClipGridInsideGraph = False.
The fully customized Smith chart can be seen below.
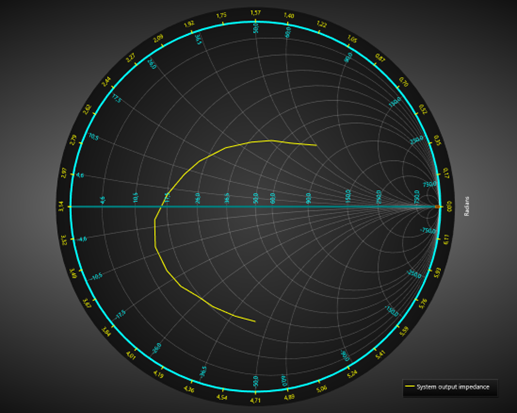
Customized Smith chart.
Margins
When AutoSizeMargins is enabled, the graph size is adjusted so that there’s enough space for all the axes and chart titles. When it is disabled, ViewSmith.Margins property applies allowing setting margins manually.
In the run time, the margins rectangle can be retrieved in pixels (or DIPs) by calling ViewSmith. GetMarginsRect() method, which applies to both automatic and manual margins. It is useful when needing to do screen-coordinate based computation or object placement.
ViewSmith. MarginsChanged event can be set to trigger when a margin rectangle has been changed because of, for example, resizing it.
The contents of the view are automatically clipped outside the margins. All contents are clipped other than the chart title, annotations and legend boxes as their position is defined in screen coordinates, allowing them to be freely positioned on the margins as well. A one or more pixel(s) wide border rectangle, Border. Width, can be drawn to display where the margins are. By default, the border is not visible in ViewSmith. The color of the rectangle can be changed via Border. Color.