PointLineSeriesSmith
ViewSmith’s PointLineSeriesSmith can be used to draw a line, a group of points or a point-line as in ViewPolar. Lots of line and point styles are available in LineStyle and PointStyle properties. Add the series to chart by adding PointLineSeriesSmith objects to ViewSmith. PointLineSeries list.
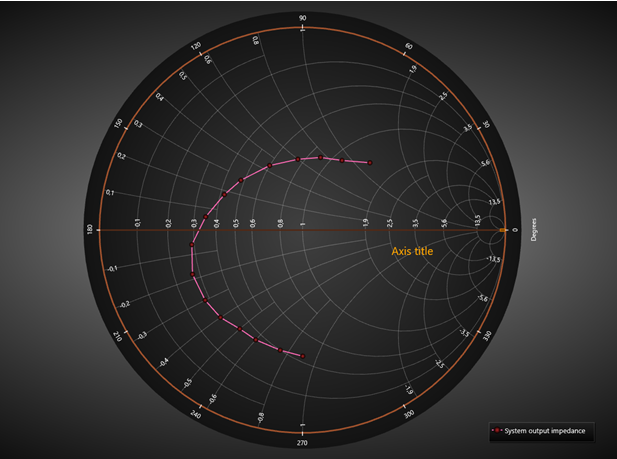
Smith data series.
Setting data
The code below, will add one set of data points to the collection of the Smith chart.
SmithSeriesPoint[] m_aPoints;
PointLineSeriesSmith Series = new PointLineSeriesSmith(m_chart.ViewSmith, axis);
//Create data for series
m_iCount = 5000;
m_aPoints = new SmithSeriesPoint[m_iCount];
for (int i = 0; i < m_iCount; i++)
{
	// Sine from left to right
	m_aPoints[i].RealValue = i * (MaxReal / m_iCount);
	m_aPoints[i].ImgValue = Math.Sin(0.01 * i)/Math.PI * MaxReal;
}
Series.Points = m_aPoints;
//Add series to chart
m_chart.ViewSmith.PointLineSeries.Add(Series);
Examples
info
To see feature demonstration as example, check SmithLine from our Demo.