Scatter
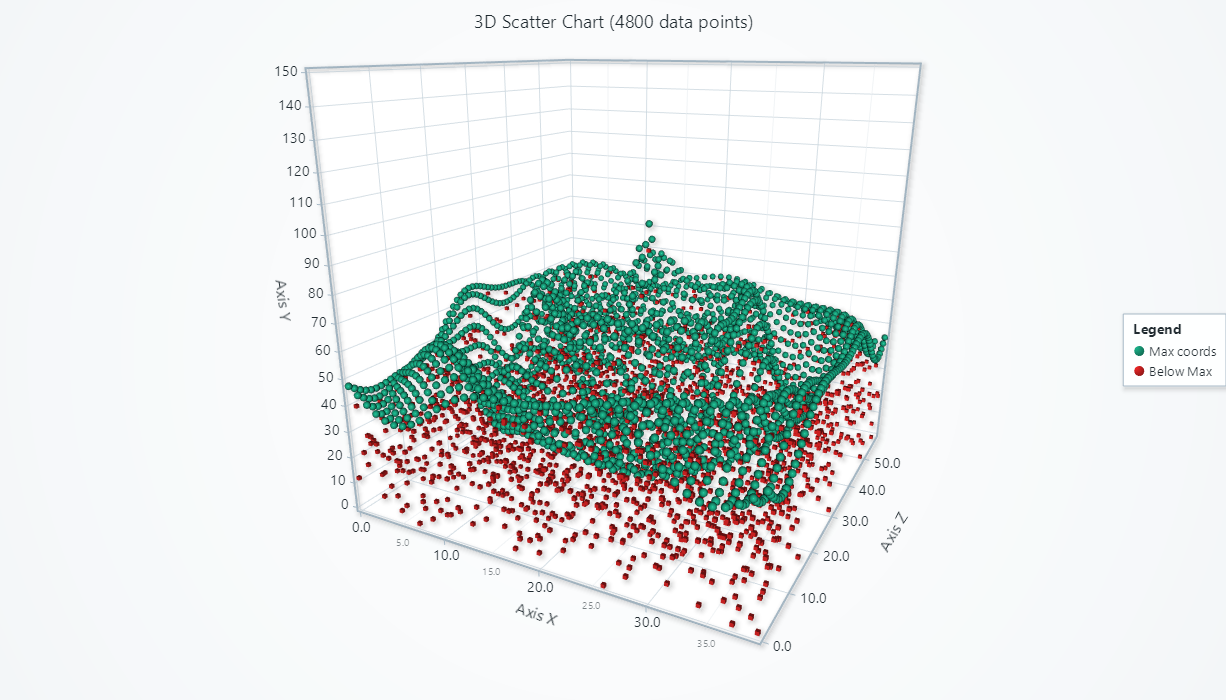
A commonly needed visualization feature is to display a set of X+Y+Z points scattered around.
// Creation of a 3D scatter series
const scatterSeries = chart.addPointSeries()

Adding data
This section works the same as for Line, to avoid duplication of guides, please refer to the section under Line
Point color
scatterSeries.setPointStyle((points) => points.setFillStyle(new SolidFill({ color: ColorRGBA(255, 0, 0) })))
For more details about style API, please see Styles, colors and fonts.
Point shape
You can select between 'cube' and 'sphere' shapes.
scatterSeries.setPointStyle((points) => points.setShape('cube'))
Point size
scatterSeries.setPointStyle((points) => points.setSize(10))
Individual colors
const colorRed = new SolidFill({ color: ColorRGBA(255, 0, 0) })
const colorGreen = new SolidFill({ color: ColorRGBA(0, 255, 0) })
const scatterSeries = chart.addPointSeries({
    individualPointColorEnabled: true,
})
    .setPointStyle((points) => points.setFillStyle(new IndividualPointFill()))
    .add([
        { x: 0, y: 0, z: 0, color: colorRed },
        { x: 1, y: 3, z: 0, color: colorRed },
        { x: 2, y: 2, z: 0, color: colorGreen },
    ])
Color by lookup table
Alternative approach to individual colors, you can give each data point a number value, and specify rules for getting a color from any number:
const scatterSeries = chart.addPointSeries({
    individualLookupValuesEnabled: true,
})
    .setPointStyle((points) => points.setFillStyle(
        new PalettedFill({
            lookUpProperty: 'value',
            lut: new LUT({
                interpolate: true,
                steps: [
                    { value: 0, color: ColorCSS('red') },
                    { value: 100, color: ColorCSS('green') },
                ]
            })
        })
    ))
    .add([
        { x: 0, y: 0, z: 0, value: 0 },
        { x: 1, y: 3, z: 0, value: 100 },
        { x: 2, y: 2, z: 0, value: 50 },
    ])
const legend = chart.addLegendBox().add(chart)
LUT has also a percentageValues option, which you can use if you want to use % values of the present min-max lookup value range, rather than specific value steps:
new LUT({
    percentageValues: true,
    interpolate: true,
    steps: [
        // 0 = 0 %, 1 = 100%
        { value: 0, color: ColorCSS('red') },
        { value: 1, color: ColorCSS('green') },
    ]
})
Color by X, Y or Z
Instead of using lookup values in data set, you can also use X, Y or Z coordinates directly, by changing the lookUpProperty value in PalettedFill.
new PalettedFill({
    lookUpProperty: 'x', // 'x', 'y' or 'z'
    lut: new LUT({
        interpolate: true,
        steps: [
            { value: 0, color: ColorCSS('red') },
            { value: 100, color: ColorCSS('green') },
        ]
    })
})
Using timestamps
This section works the same as for Line, to avoid duplication of guides, please refer to the section under Line
Data cleaning / maximum memory use
This section works the same as for Line, to avoid duplication of guides, please refer to the section under Line
Editing or clearing data
This section works the same as for Line, to avoid duplication of guides, please refer to the section under Line
3D color shading
This section works the same as for Line, to avoid duplication of guides, please refer to the section under Line
Depth testing
This section works the same as for Line, to avoid duplication of guides, please refer to the section under Line
Interactions with data points
This section works the same as for Line, to avoid duplication of guides, please refer to the section under Line