3D LiDAR Chart
Once in a while user may need to visualize tens of millions samples as point-cloud. For example, LiDAR (or Light Detection and Ranging) device could generate such type of data. Certainly it is challenging, but LightningChart control is able to create interactive chart with 100 million points (and more, if user have powerful computer).
The core feature of 'LiDAR Chart' is PointsCompactColored property (SeriesPointCompactColored3D array) of PointLineSeries3D. PointsCompactColored property enables low memory consumption, important when having a lot of data points, but still allows coloring the points with individual colors.
SeriesPointCompactColoured3D structure consists of the following fields:
- float X: X axis value
- float Y: Y axis value
- float Z: Z axis value
- int Color: Color of the point
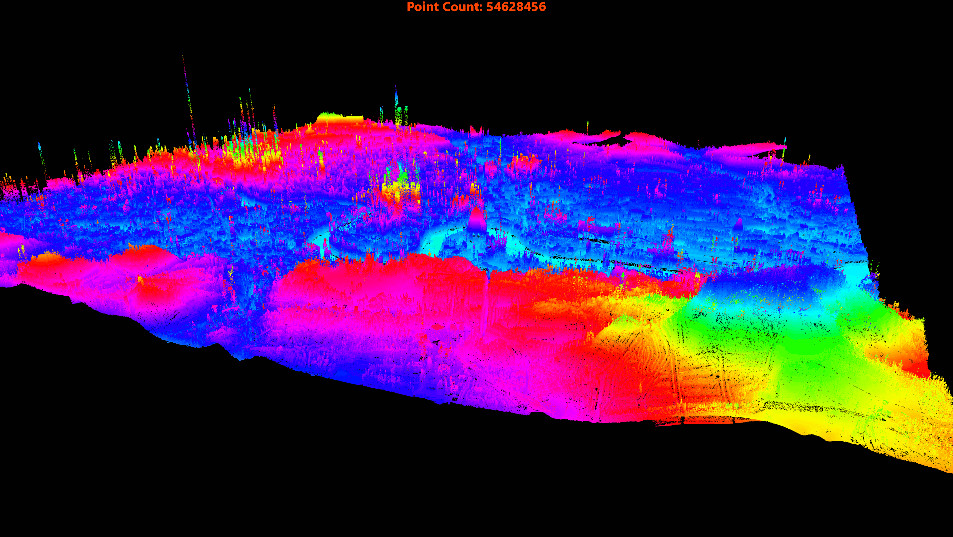 The topographic data from London. All together renders 55 million data points
For Step-by-step tutorial how to create 3D LiDAR Chart with LightningChart .NET library check following link.