Area Range
Area range series can fill sections between two variables.
// Creation of an area range series
const areaRangeSeries = chart.addAreaRangeSeries()
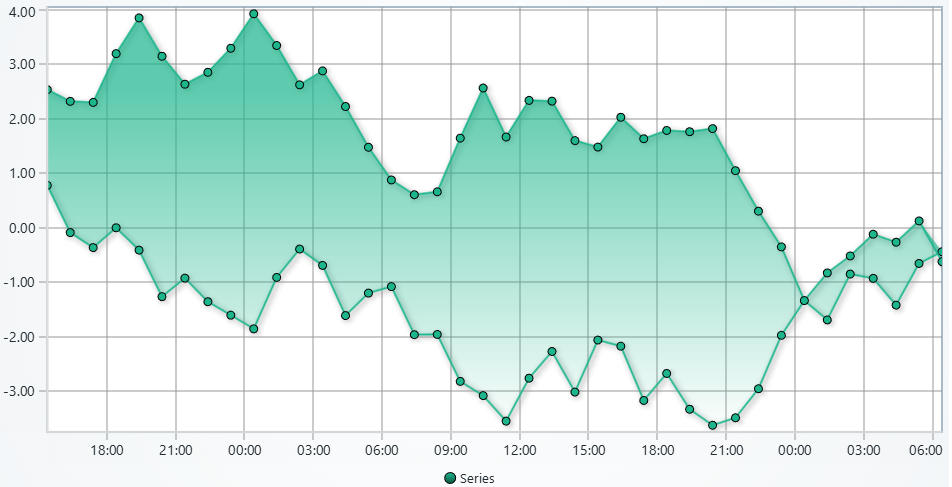
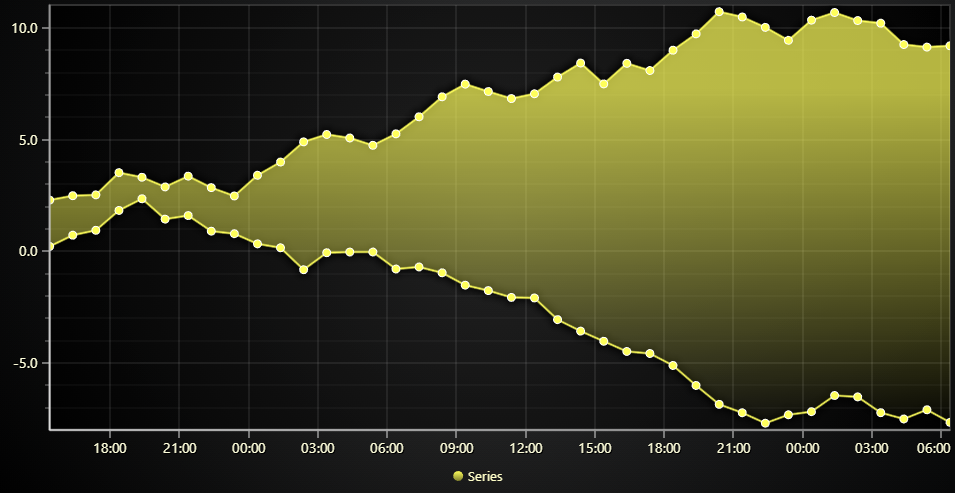
Adding data, schema and data mapping
For the most part, AreaRangeSeries works exactly same as other XY series.
This section only covers the unique aspects to AreaRangeSeries, for more instructions, see Line
AreaRangeSeries requires 3 variables per data point: position, range1 and range2.
These can be provided just like with other XY series and connected via data mapping:
// Example, automatic "position" values, load range1 from "temperatureMin" and range2 from "temperatureMax"
const areaRangeSeries = chart.addAreaRangeSeries({
    schema: {
        position: { auto: true },
        temperatureMin: { pattern: null },
        temperatureMax: { pattern: null },
    }
})
    .appendSamples({
        temperatureMax: [12, 13, 9, 10, 12, 15, 14],
        temperatureMin: [4, 8, 7, 9, 6, 7, 8]
    })
    .setDataMapping({ position: 'position', range1: 'temperatureMin', range2: 'temperatureMax' })
Orientation
AreaRangeSeries can be either horizontal or vertical. This must be selected when creating the series:
const areaRangeSeries = chart.addAreaRangeSeries({ orientation: 'vertical' })
The orientation does not affect how data mapping etc. should be performed.
Insymmetric styling
The two sides of AreaRangeSeries can be styled individually - for example, removing points and/or stroke from one side.
areaRangeSeries
    .setStrokeStyle(emptyLine, { range1: false, range2: true })
    .setPointFillStyle(emptyFill, { range1: false, range2: true })
Similarly, cursor behavior can be customized if only one of the range values should be displayed in cursor:
areaRangeSeries.setCursorBehavior({ showRange1: true, showRange2: false })
Area color
areaSeries.setAreaFillStyle(new SolidFill({ color: ColorRGBA(255, 0, 0) }))
For more details about style API, please see Styles, colors and fonts.
Area stroke
This section works the same as for Line, to avoid duplication of guides, please refer to the section under Line
Points
This section works the same as for Scatter, to avoid duplication of guides, please refer to the section under Scatter
Using timestamps
This section works the same as for Line, to avoid duplication of guides, please refer to the section under Line
Data cleaning / maximum memory use
This section works the same as for Line, to avoid duplication of guides, please refer to the section under Line
Connecting to non-default axis
This section works the same as for Line, to avoid duplication of guides, please refer to the section under Line
Solve nearest from location
This section works the same as for Line, to avoid duplication of guides, please refer to the section under Line
Individual colors
This section works the same as for Scatter, to avoid duplication of guides, please refer to the section under Scatter
Color by lookup table
This section works the same as for Scatter, to avoid duplication of guides, please refer to the section under Scatter
Color by X or Y
This section works the same as for Scatter, to avoid duplication of guides, please refer to the section under Scatter
Color by gradient
This section works the same as for Scatter, to avoid duplication of guides, please refer to the section under Scatter
Edit samples data
This section works the same as for Line, to avoid duplication of guides, please refer to the section under Line
Read back data
This section works the same as for Line, to avoid duplication of guides, please refer to the section under Line
Data storage optimization
This section works the same as for Line, to avoid duplication of guides, please refer to the section under Line
Separating data sets from series
This section works the same as for Line, to avoid duplication of guides, please refer to the section under Line
Scaling, offsetting and transforming coordinates
This section works the same as for Line, to avoid duplication of guides, please refer to the section under Line