Sun Burst Chart
Apart from high performance data visualization features, LightningChart JS also includes commonly needed standard features, such as Sun burst charts:
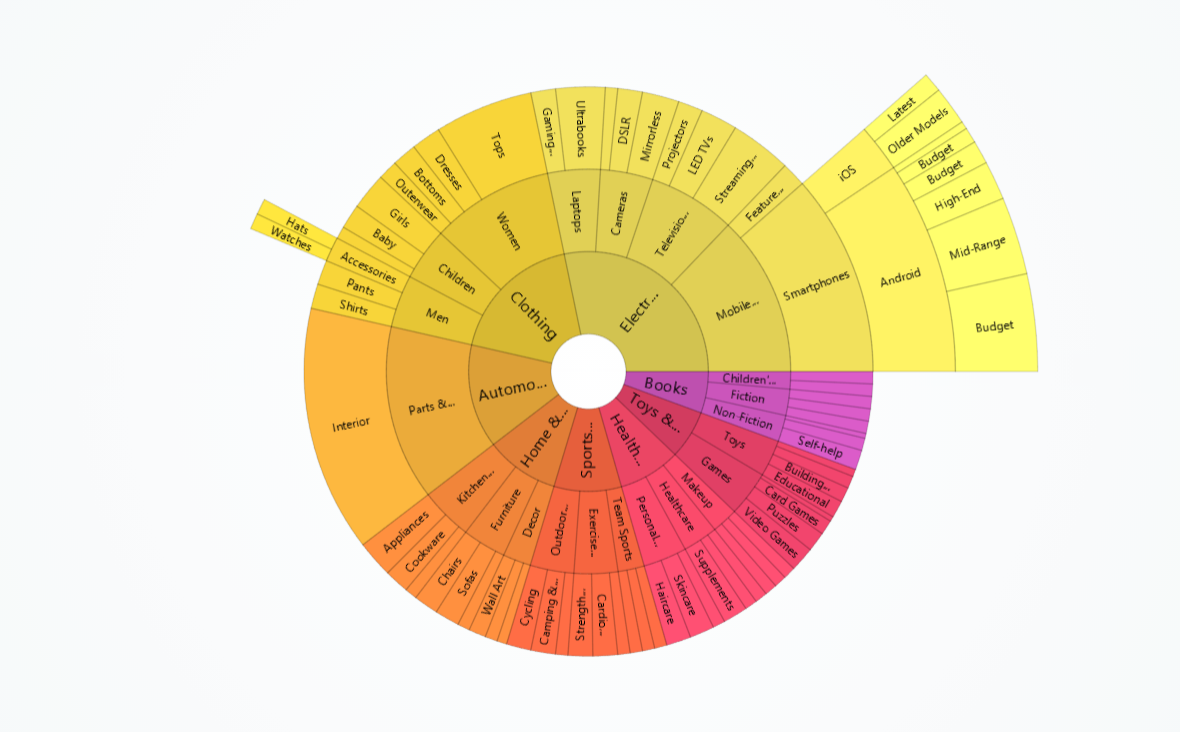
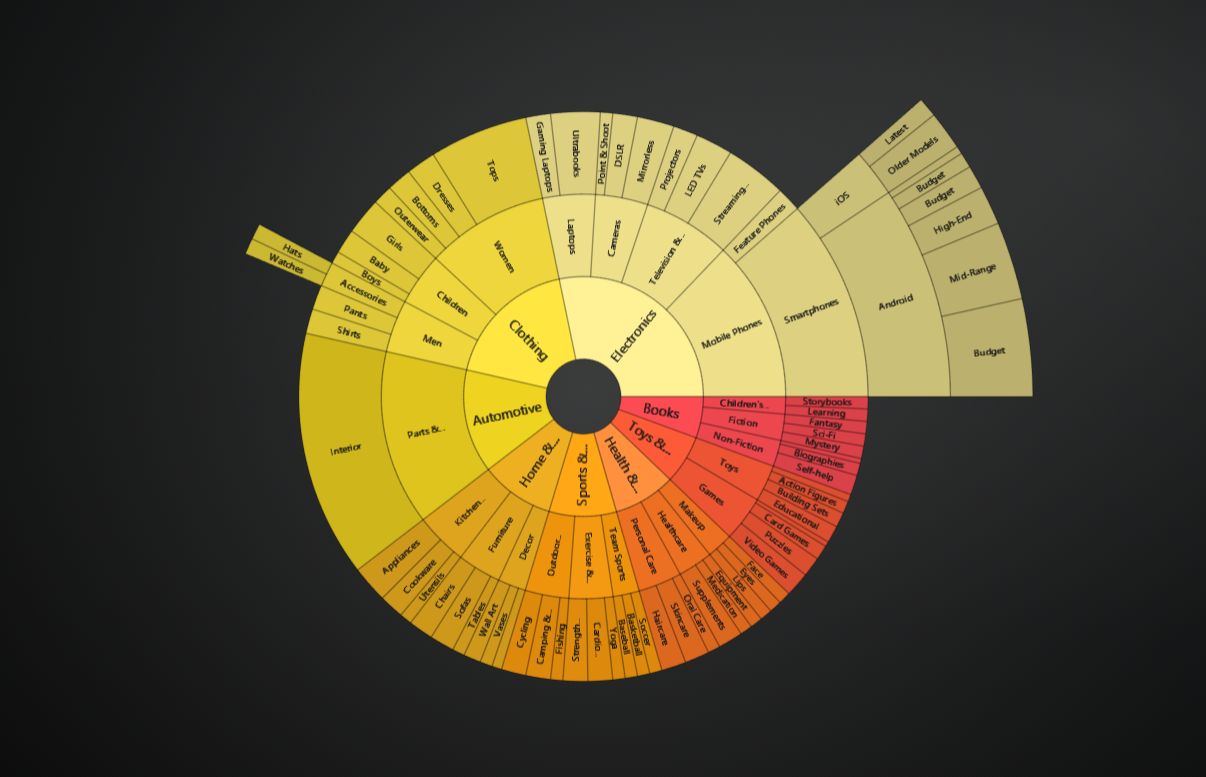
// Creation of Sun burst chart
const sunBurstChart = lc.SunBurstChart()
Adding data
const data = [{
    name: 'TECHNOLOGY',
    children: [
        { name: 'MSFT', value: 60.34 },
        { name: 'AAPL', value: 52.75 },
        { name: 'ORCL', value: 31.25 },
        { name: 'ADBE', value: 81.71 },
        { name: 'NVDA', value: 252.82 },
        { name: 'AVGO', value: 104.86 },
        { name: 'CRM', value: 104.83 },
        { name: 'INTU', value: 66.01 },
    ],
}]
sunBurstChart.setData(data)
Node Drilling
The Sun burst chart allows users to drill down into specific nodes by clicking on them. This feature can be enabled or disabled using the setUserInteractions method.
sunBurstChart.setUserInteractions({
    drillDown: {
        click: false,
    },
})
Programmatically Drilling Down
The setDrillDownNode method allows you to focus on and render a specific node within the Sun burst. This is particularly useful when dealing with hierarchical data, as it enables a more detailed exploration of subsets of the data. To use this feature, you must first set your data using the setData method. Here’s an example:
const data = [{
    name: 'Level 1',
    children: [
        { name: 'Level 1.1', value: 5 },
        { name: 'Level 1.2', value: 10 },
        { name: 'Level 1.3', children: [
           { name: 'Level 1.3,1', value: 10},
            {name: 'Level 1.3.2', value:  5}
        ] },
    ],}
]

sunBurstChart.setData(data)
sunBurstChart.setDrillDownNode(data[0].children[2])
Displayed Levels Count
The setDisplayedLevelsCount method allows you to control the number of levels of children nodes to display in the Sun burst.
sunBurstChart.setDisplayedLevelsCount(2)
Initial Path Button Text
The setInitPathButtonText method allows you to set the text for the back button that returns the view to the first level of nodes.
sunBurstChart.setInitPathButtonText('Reset')
Node colors
The setNodeColoring method allows you to specify a set of colors to be used for the nodes in the Sun burst.
In this example, the Sun burst nodes will cycle through the colors red, green, and blue.
sunBurstChart.setNodeColoring([ColorCSS('red'), ColorCSS('green'), ColorCSS('blue')])
Node colors by value
The setNodeColoring method can also be used to color nodes based on their values.
sunBurstChart.setNodeColoring(
     new PalettedFill({
         lut: new LUT({
             steps: [
                 { value: 0, color: ColorCSS('red') },
                 { value: 20, color: ColorCSS('blue') },
             ],
             interpolate: true,
         }),
     }),
)
Node user interactions
User interactions on each node can be tracked individually:
sunBurstChart.nodes.addEventListener('click', (event, node) => {
    console.log(node)
})
Chart title
sunBurstChart
    .setTitle('Voltage')
    .setTitleFont(font => font.setSize(10).setFamily('Segoe UI'))
    .setTitleFillStyle(new SolidFill({ color: ColorRGBA(255, 0, 0) }))
For more details about style API, please see Styles, colors and fonts.
Background style
Sun burstChart has 2 different levels of backgrounds:
- Chart background (entire chart area)
- Engine background (additional background shared by entire engine)
- Understanding difference between chart/engine background is mainly useful if you are using the legacy
Dashboardfeature - in this case, engine background is shared across the whole dashboard.
- Understanding difference between chart/engine background is mainly useful if you are using the legacy
sunBurstChart.setBackgroundFillStyle(new SolidFill({ color: ColorRGBA(255, 0, 0) }))
sunBurstChart.engine.setBackgroundFillStyle(new SolidFill({ color: ColorRGBA(0, 0, 255) }))
For more details about style API, please see Styles, colors and fonts.
Space around chart
sunBurstChart.setPadding({ left: 10, right: 10, top: 10, bottom: 10 })
Cursors
Please see common Cursors section.
Legend
Please see common Legend section.
Positioning charts
Please see common Positioning charts section.
Color themes
Please see common Color themes section.