Polar Microphone Sensitivity JavaScript Chart
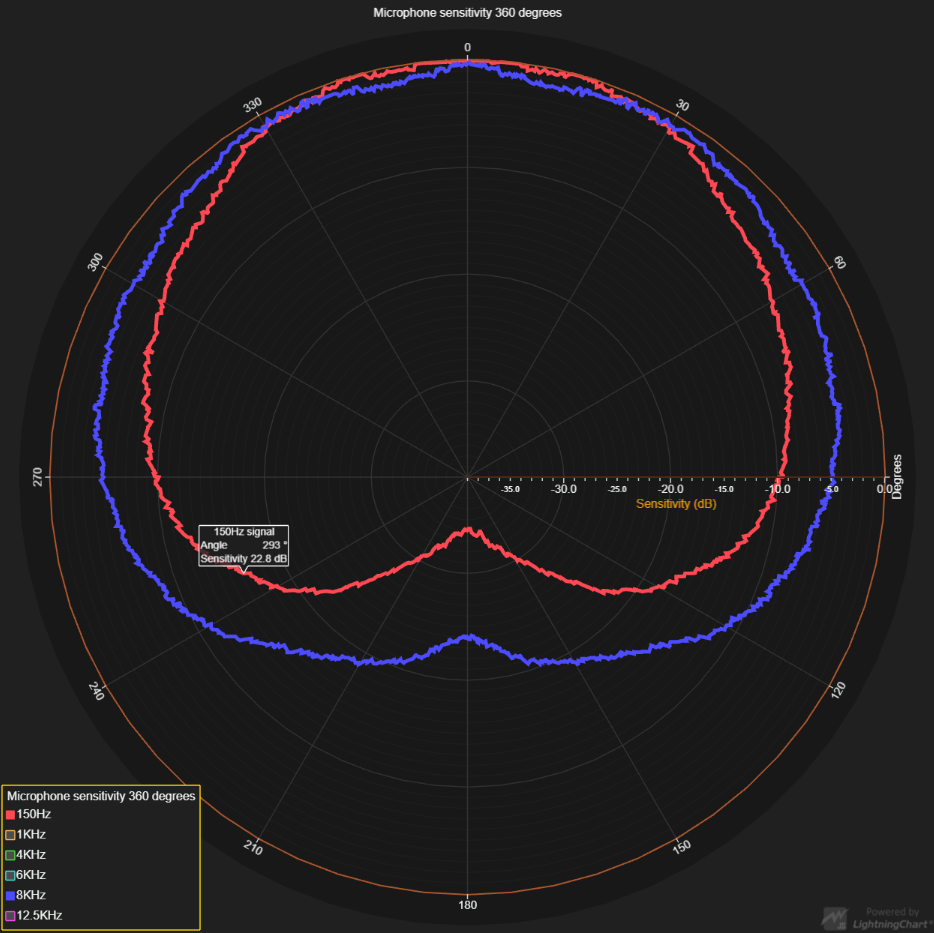
This example showcases a simple Polar Chart with five Line Series.
Polar Charts are used for visualizing data relationships in terms of radiuses and angles.
Polar coordinate system and PolarLineSeries
{
    // Data point angle as degrees [0, 360].
    angle: 0,
    // Data point position on the *Amplitude Axis*. Determines its location between the Charts origin and outer edge.
    amplitude: 50
}
PolarLineSeries connects a list of such PolarPoints with a continuous line.
PolarRadialAxis
The coordinate system can be rotated with methods of *PolarRadialAxis**.
// Configure Polar Radial Axis.
const radialAxis = polar
    .getRadialAxis()
    // 0 = North
    .setRotation(90)
    // Clockwise direction.
    .setInverted(true)
PolarAmplitudeAxis
Similarly, the visible range of amplitude values can be configured with methods of PolarAmplitudeAxis. The default configuration is to fit
const amplitudeAxis = polar
    .getAmplitudeAxis()
    // Set amplitude interval explicitly.
    // [-39 dB, 0 dB]
    .setInterval({ start: -39, end: 0, stopAxisAfter: false })
    .setTitle('Sensitivity (dB)')