JavaScript Re-arrangeable Dashboard
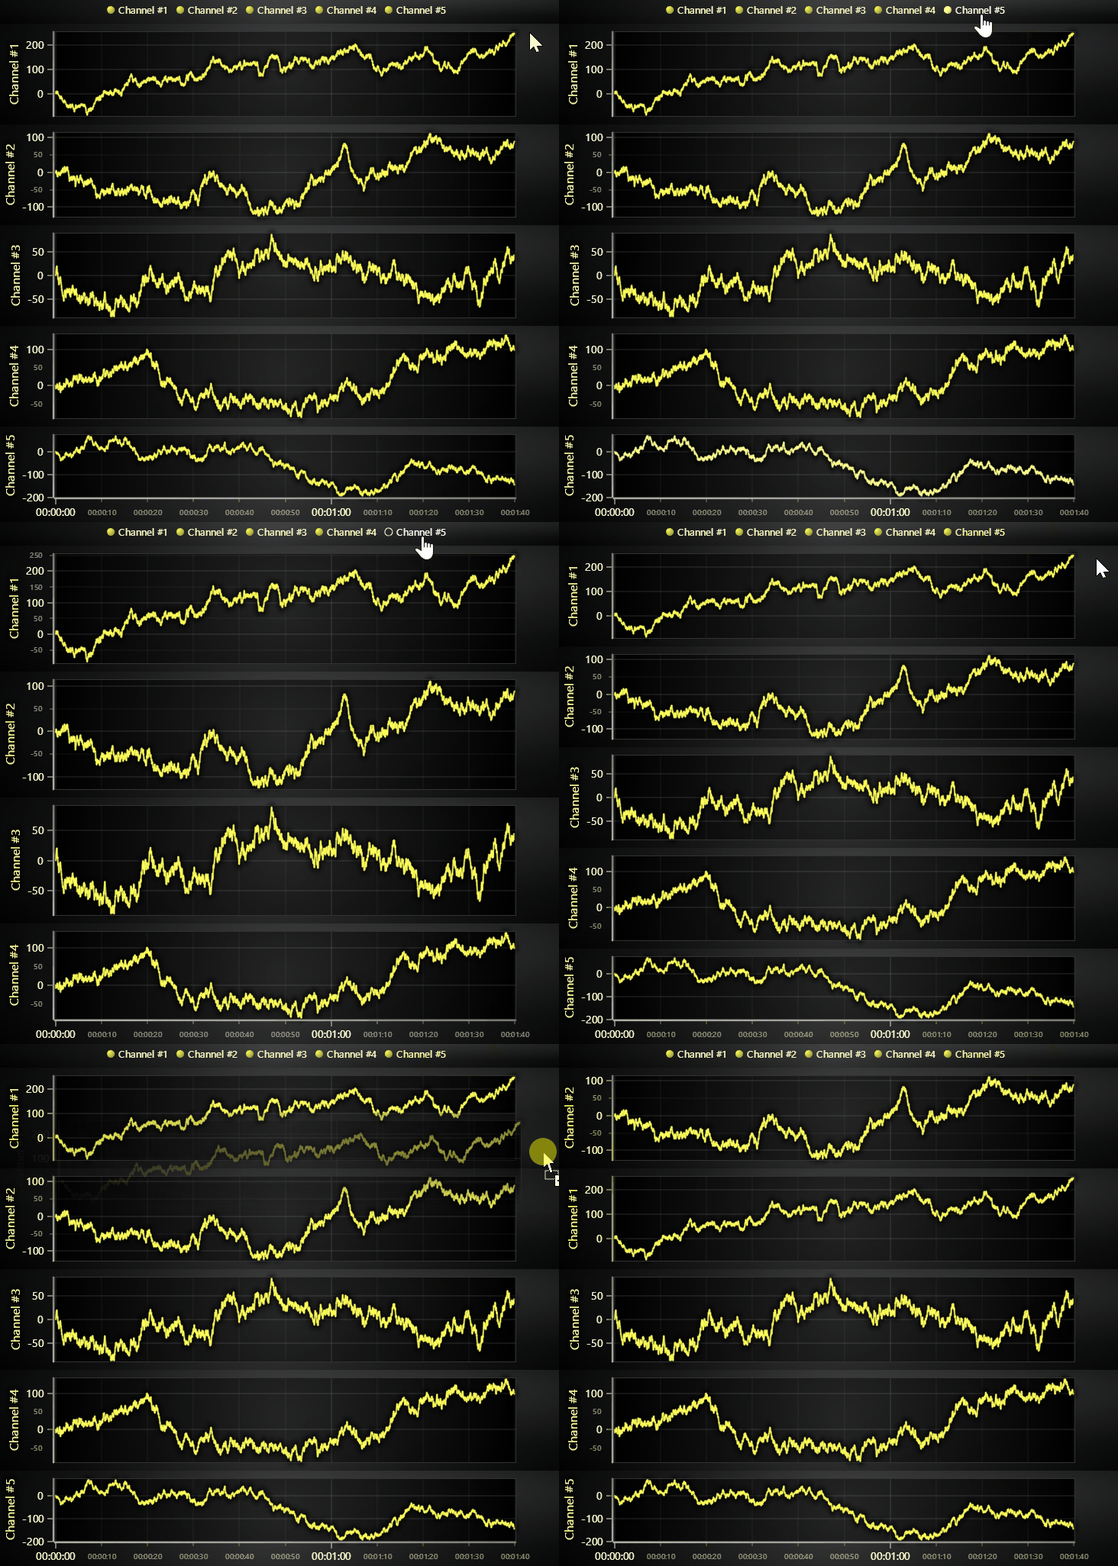
Re-arrangeable Dashboard example.
This example shows how to create a Dashboard with a number of channels which you can re-arrange using drag & drop or hide/show using the legend.

Note that this example doesn't actually use the built-in "Dashboard" feature.
Instead, it relies on WebGL context sharing, a new capability added in LightningChart JS v5.0.0.
This lets the user use CSS layouts to control the position, size and visibility of as many charts as needed while enjoying the traditional performance advantages of LightningChart Dashboards.
Using shared WebGL contexts is as simple as creating all charts using the same LightningChart instance:
const lc = lightningChart()
const chart1 = lc.ChartXY()
const chart2 = lc.ChartXY()
...
For more information, refer to "Grouping charts" section in Developer Documentation.