Close Editor Run Reset Auto Update CJS /*
* Example showcasing real-time, partial data updates to Polar Heatmap.
*/
const lcjs = require('@lightningchart/lcjs')
const { lightningChart, Themes, LUT, PalettedFill, regularColorSteps, SolidFill, ColorRGBA, PointShape, emptyLine } = lcjs
const sensors = [
{ angle: 0, amplitude: 0, value: Math.random() },
{ angle: 0, amplitude: 3, value: Math.random() },
{ angle: 30, amplitude: 3, value: Math.random() },
{ angle: 60, amplitude: 3, value: Math.random() },
{ angle: 90, amplitude: 3, value: Math.random() },
{ angle: 120, amplitude: 3, value: Math.random() },
{ angle: 150, amplitude: 3, value: Math.random() },
{ angle: 180, amplitude: 3, value: Math.random() },
{ angle: 210, amplitude: 3, value: Math.random() },
{ angle: 240, amplitude: 3, value: Math.random() },
{ angle: 270, amplitude: 3, value: Math.random() },
{ angle: 300, amplitude: 3, value: Math.random() },
{ angle: 330, amplitude: 3, value: Math.random() },
{ angle: 0, amplitude: 7, value: Math.random() },
{ angle: 30, amplitude: 7, value: Math.random() },
{ angle: 60, amplitude: 7, value: Math.random() },
{ angle: 90, amplitude: 7, value: Math.random() },
{ angle: 120, amplitude: 7, value: Math.random() },
{ angle: 150, amplitude: 7, value: Math.random() },
{ angle: 180, amplitude: 7, value: Math.random() },
{ angle: 210, amplitude: 7, value: Math.random() },
{ angle: 240, amplitude: 7, value: Math.random() },
{ angle: 270, amplitude: 7, value: Math.random() },
{ angle: 300, amplitude: 7, value: Math.random() },
{ angle: 330, amplitude: 7, value: Math.random() },
{ angle: 0, amplitude: 10, value: Math.random() },
{ angle: 30, amplitude: 10, value: Math.random() },
{ angle: 60, amplitude: 10, value: Math.random() },
{ angle: 90, amplitude: 10, value: Math.random() },
{ angle: 120, amplitude: 10, value: Math.random() },
{ angle: 150, amplitude: 10, value: Math.random() },
{ angle: 180, amplitude: 10, value: Math.random() },
{ angle: 210, amplitude: 10, value: Math.random() },
{ angle: 240, amplitude: 10, value: Math.random() },
{ angle: 270, amplitude: 10, value: Math.random() },
{ angle: 300, amplitude: 10, value: Math.random() },
{ angle: 330, amplitude: 10, value: Math.random() },
]
const resolutionSectors = 16
const resolutionAnnuli = 10
const amplitudeMin = 0
const amplitudeMax = 10
const angleStep = 360 / resolutionSectors
const amplitudeStep = (amplitudeMax - amplitudeMin) / resolutionAnnuli
const polarChart = lightningChart().Polar({
// theme: Themes.darkGold,
})
const themeExamples = polarChart.getTheme().examples
if (!themeExamples) {
throw new Error()
}
const pointSeries = polarChart
.addPointSeries()
.setName('Sensor locations')
.setPointSize(10)
.setPointShape(PointShape.Circle)
.setData(sensors)
.setCursorEnabled(false)
.setAutoScrollingEnabled(false)
const polarHeatmap = polarChart
.addHeatmapSeries({
sectors: resolutionSectors,
annuli: resolutionAnnuli,
amplitudeStart: amplitudeMin,
amplitudeEnd: amplitudeMax,
dataOrder: 'annuli',
})
.setName('Heatmap')
.setIntensityInterpolation('bilinear')
.setHighlightOnHover(false)
// This series is intended for helping understand the example. It displays the location of heatmap cells in the chart.
// The application extrapolates a data value for each of these locations and pushes those to the heatmap.
const cellLocationsSeries = polarChart
.addPointSeries()
.setName('Cell locations')
.setPointSize(3)
.setPointShape(PointShape.Square)
.setPointFillStyle(new SolidFill({ color: ColorRGBA(0, 0, 0, 100) }))
.setPointStrokeStyle(emptyLine)
.setCursorEnabled(false)
.setPointerEvents(false)
const lut = new LUT({
steps: regularColorSteps(0, 1, themeExamples.coldHotColorPalette, { alpha: 100 }),
interpolate: true,
})
const palette = new PalettedFill({
lut,
})
polarHeatmap.setFillStyle(palette)
polarChart.forEachAxis((axis) => axis.fit(false))
requestAnimationFrame(() => {
const heatmapData = new Array(resolutionAnnuli).fill(0).map((_) => new Array(resolutionSectors).fill(0))
const debugCellLocations = []
console.time('calc heatmap cell locations')
const heatmapCells = []
for (let iAmplitude = 0; iAmplitude < resolutionAnnuli; iAmplitude += 1) {
const annuliCells = []
heatmapCells.push(annuliCells)
for (let iSector = 0; iSector < resolutionSectors; iSector += 1) {
const angle = iSector * angleStep
const amplitude = iAmplitude * amplitudeStep
debugCellLocations.push({ angle, amplitude })
const cellLocationPixels = polarChart.translateCoordinate({ angle, amplitude }, polarChart.coordsRelative)
const weights = new Array(sensors.length).fill(0)
annuliCells.push({ cellLocationPixels, weights, weightsSum: 0 })
}
}
console.timeEnd('calc heatmap cell locations')
cellLocationsSeries.setData(debugCellLocations)
/**
* Weights only need to be calculated every time a sensor location changes.
* It is a very heavy operation, which should only be performed when needed.
*/
const calculateWeights = () => {
// For each heatmap cell, calculate a weight to every sensor.
console.time('calc weights')
for (let iAmplitude = 0; iAmplitude < resolutionAnnuli; iAmplitude += 1) {
for (let iSector = 0; iSector < resolutionSectors; iSector += 1) {
const cell = heatmapCells[iAmplitude][iSector]
let weightsSum = 0
sensors.forEach((sensor, i) => {
const sensorLocationPixels = polarChart.translateCoordinate(sensor, polarChart.coordsRelative)
const distance = Math.sqrt(
(sensorLocationPixels.x - cell.cellLocationPixels.x) ** 2 +
(sensorLocationPixels.y - cell.cellLocationPixels.y) ** 2,
)
let weight = 1
if (distance !== 0) {
weight = 1 / distance ** 3
}
cell.weights[i] = weight
weightsSum += weight
})
cell.weightsSum = weightsSum
}
}
console.timeEnd('calc weights')
/**
* Return method for refreshing heatmap with updated values.
*/
return () => {
// Extrapolate value for each heatmap cell, considering all the sensors.
for (let iAmplitude = 0; iAmplitude < resolutionAnnuli; iAmplitude += 1) {
for (let iSector = 0; iSector < resolutionSectors; iSector += 1) {
const cell = heatmapCells[iAmplitude][iSector]
const sum = sensors.reduce((prev, cur, i) => prev + cur.value * cell.weights[i], 0)
const value = sum / cell.weightsSum
heatmapData[iAmplitude][iSector] = value
}
}
polarHeatmap.invalidateIntensityValues(heatmapData)
}
}
const refreshHeatmap = calculateWeights()
// For demo purposes, change value of every sensor randomly 60 times per second and refresh heatmap.
const frame = () => {
sensors.forEach((sensor) => {
sensor.value = Math.max(Math.min(sensor.value + 0.05 * (Math.random() * 2 - 1), 1), 0)
})
refreshHeatmap()
requestAnimationFrame(frame)
}
frame()
})
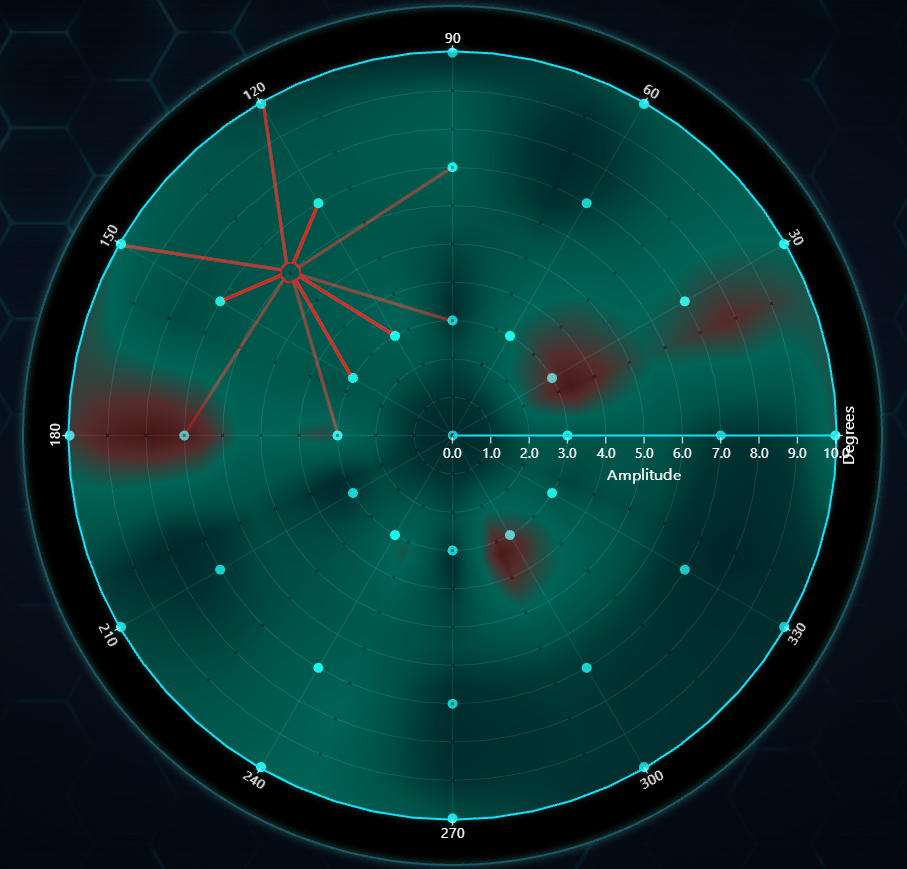
JavaScript Real-Time Polar Sensor Chart - Editor Showcase of using Polar Heatmap to visualize a scatter data set in polar coordinates.
To explain that a bit further, the example establishes a number of sensors that are positioned in polar coordinates (angle + amplitude). Each sensor has a numeric measurement, which could be temperature, voltage, etc. These measurements are then extrapolated to linearly ease in the gaps between the sensors. The final extrapolated data set is then visualized with a heatmap.
The example simulates the sensor measurements changing in real-time (60 times per second), immediately recalculates the extrapolated heatmap data and displays it with low latency.
The extrapolation algorithm can be found in the example source code.
This is a simple but robust algorithm that works for a variety of use cases.