Date of case study: 04/2022
Industry of business: Outdoor Power Products
Established: 1689
LightningChart solution: XY Charts
Husqvarna AB
Originally founded in 1689, Husqvarna is a company dedicated to manufacturing a variety of outdoor power tools including chainsaws, jigsaws, disc cutters, lawnmowers, garden tractors, and several more.
Many of the tools developed by Husqvarna run on a battery with an electric motor which can be trimmed using many different parameters in order to make the motor as efficient as possible.
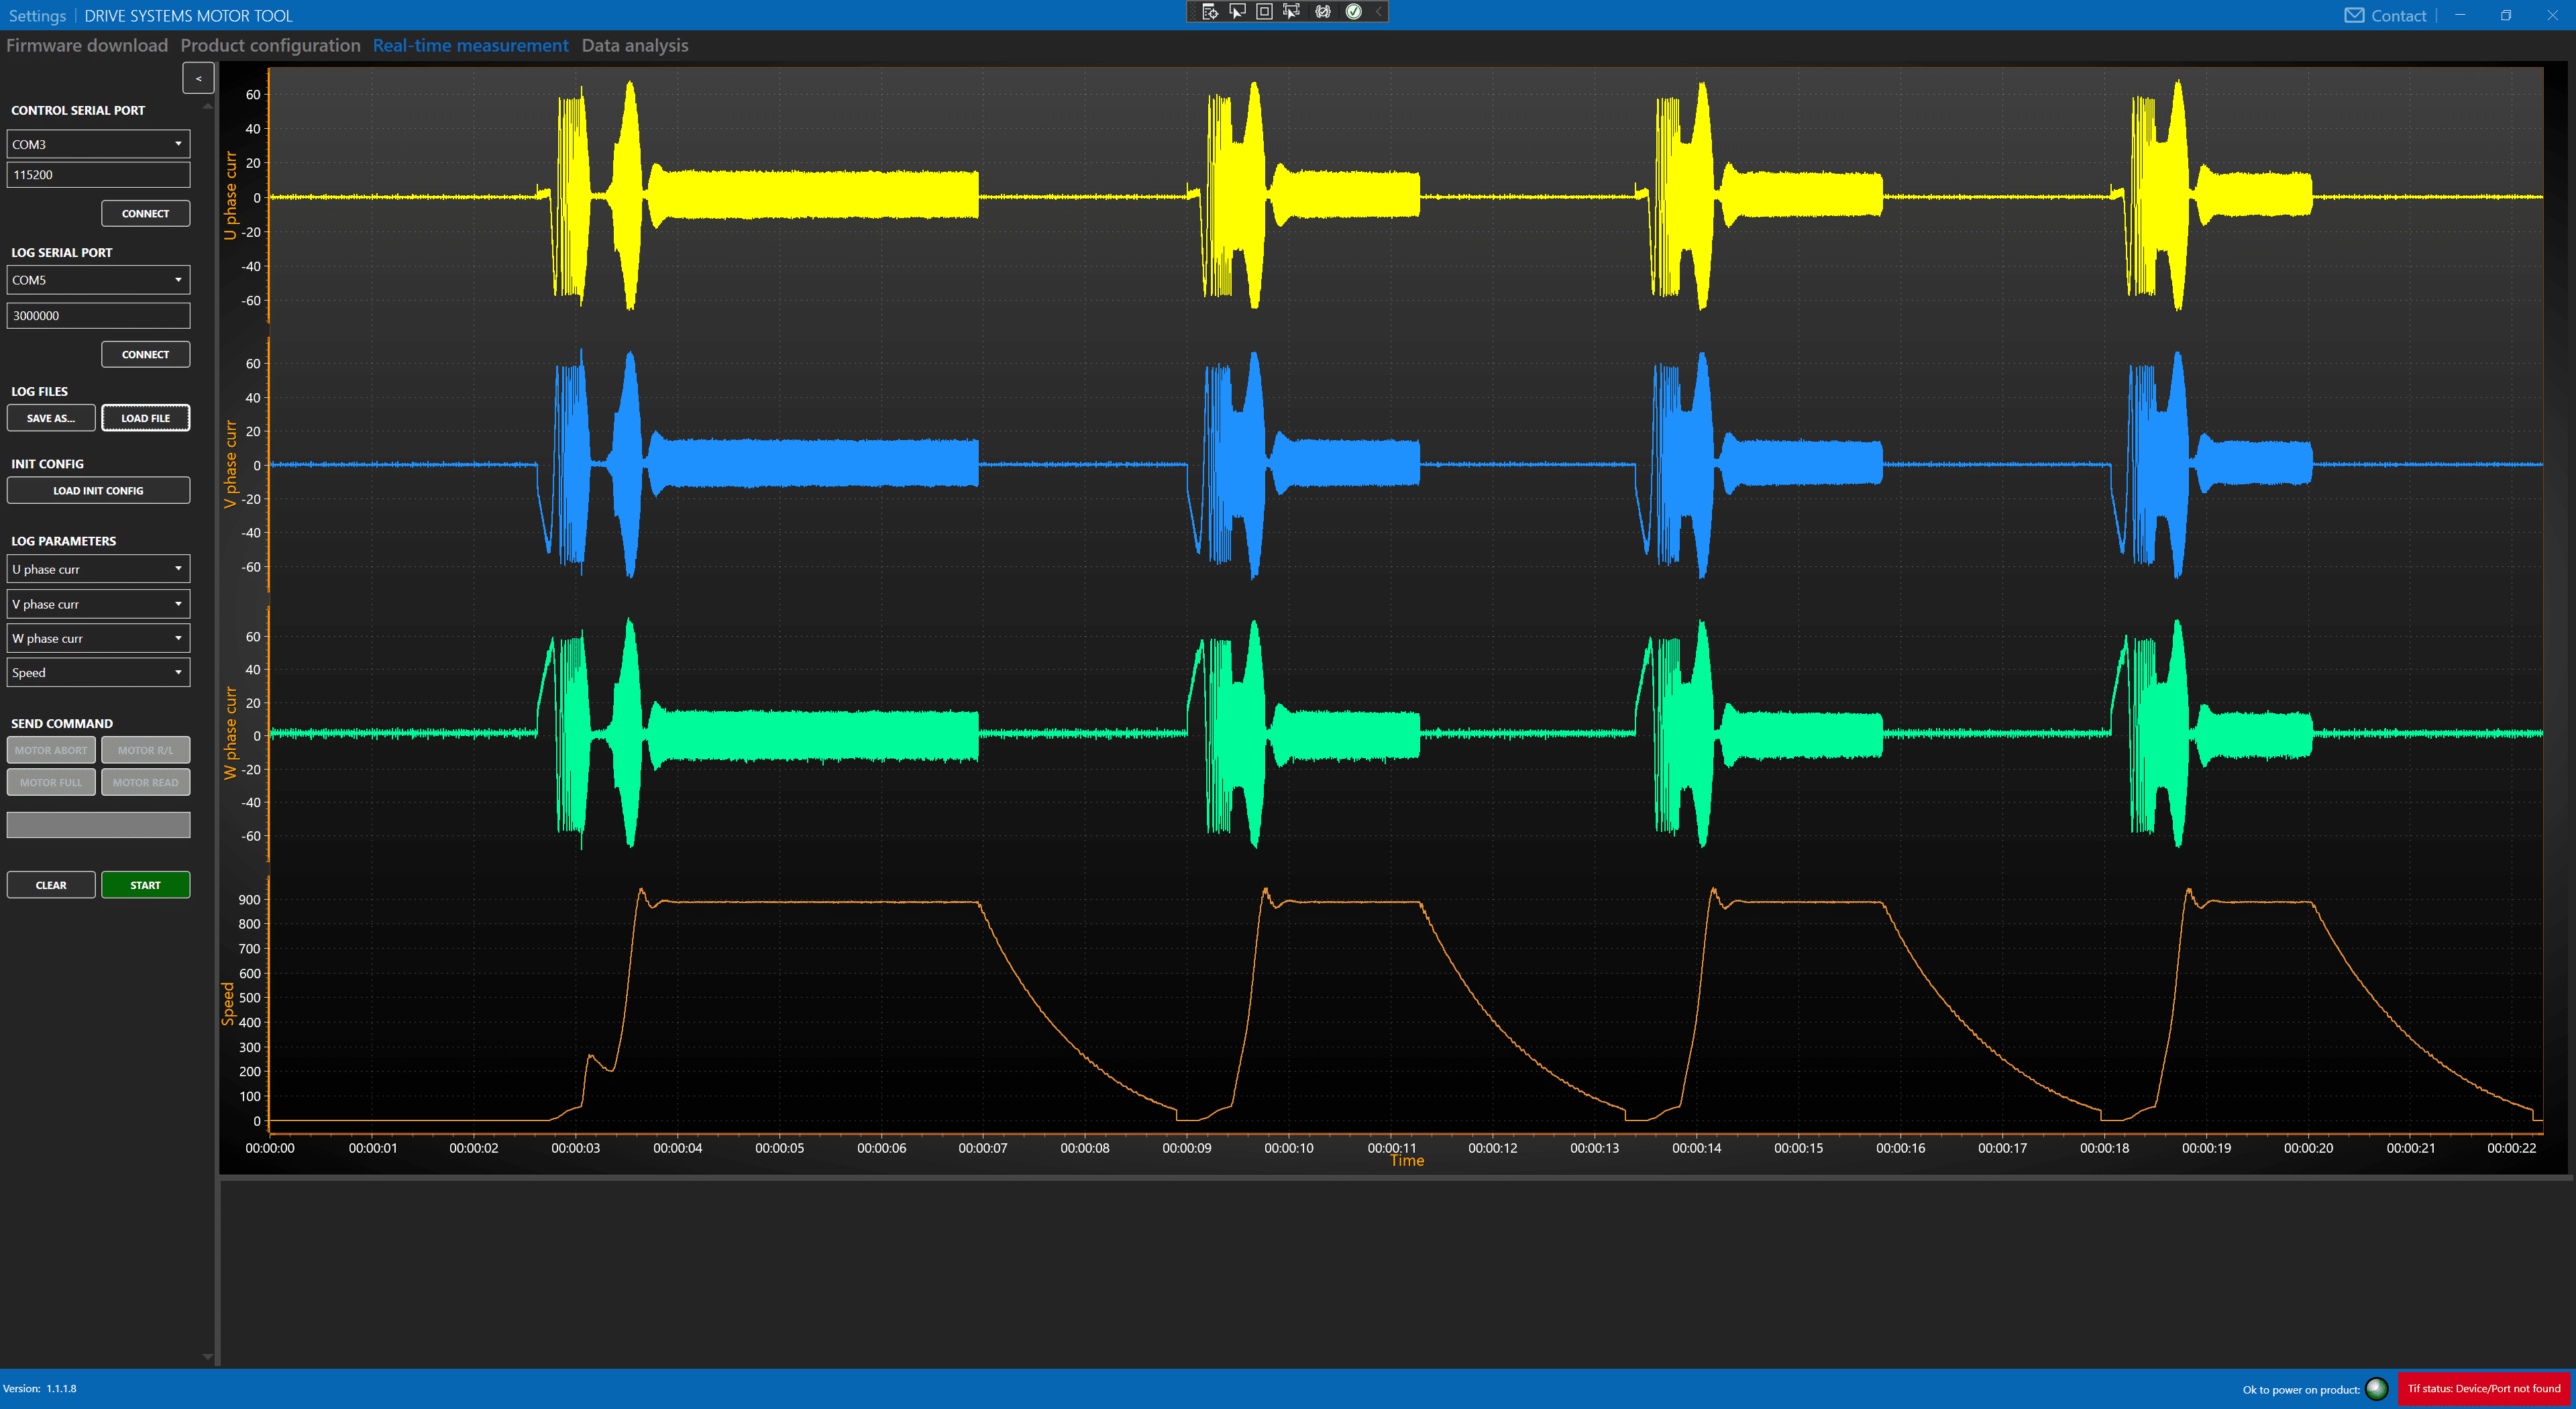
Husqvarna has developed a software tool that measures real-time log data from the outdoor power tools’ motors and displays it in a chart using LightningChart data visualization controls.
This enables Husqvarna to see how the motor behaves in different real-time scenarios. The application is also able to save the logs and compare two different runs in a split-screen mode.
Picture 1. Drive systems motor tool
Why choosing LightningChart® .NET?
One of our main requirements was to find a charting control with a fast response and capable to handle real-time data.
After testing the 30-day trial period the choice was very easy for us. LightningChart supports a very fast sample rate without any lagging which was something we needed. It also offered great support and the charts look very nice.
By using LightningChart we are able to trim the parameters of our electric motors in our power tools in an easier way.
This will make the motors become more efficient and increase the quality of our outdoor power tools.
“LightningChart is easy to use, looks professional, supports fast sample rate without any lagging.”
Picture 2. Drive systems motor tool
What was your experience with LightningChart® Tech Support?
We used LightningChart’s tech support during the trial period and we found the support to be very helpful and customized to the problem I was facing during development.


