JavaScript Polar Chart EM Field Strength
This example showcases a simple Polar Chart with two Area Series.
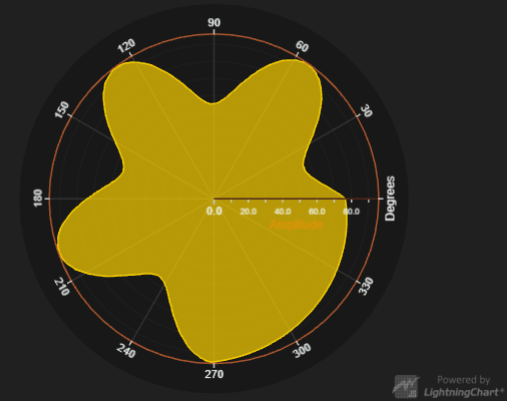
PolarAreaSeries
PolarAreaSeries connects a list of PolarPoints with a stroke, and fills the enclosed area.
Automatic closing of data points
By enabling automatic closing of data points
PolarAreaSeries.setConnectDataAutomaticallyEnabled(true)you can ensure that the highlighted area will be closed. In this picture there were only data points supplied for angles [0, 270], from there on, the data was automatically closed with a linear interpolation.