JavaScript Data Gaps Trading Chart
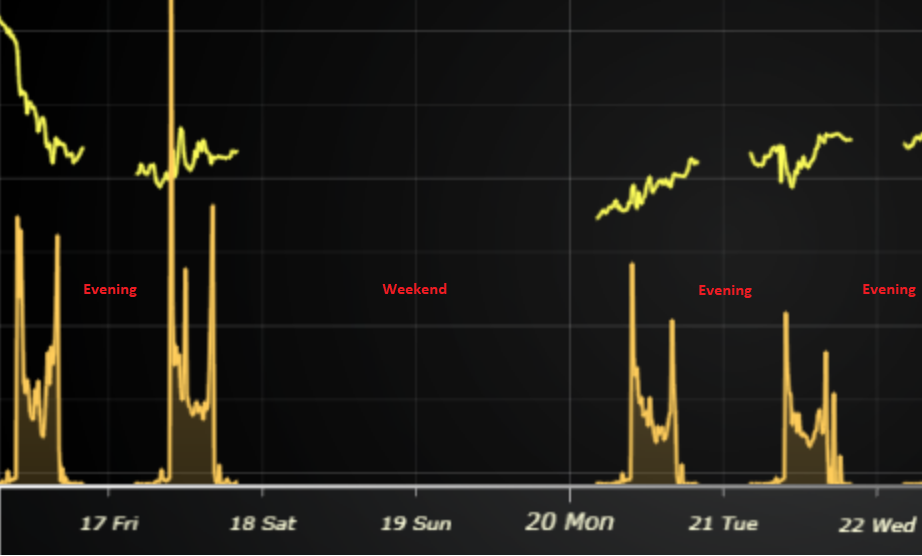
Normally, series types such as LineSeries, AreaSeries, etc. automatically connect data points to highlight the progression of trend values. In some specific use cases, this is not the ideal behavior as data may contain frequent data gaps, meaning relatively large time intervals when there are no data samples available.
In LightningChart JS, data gaps can be specified by adding an extra data point with value of NaN (Not-A-Number).
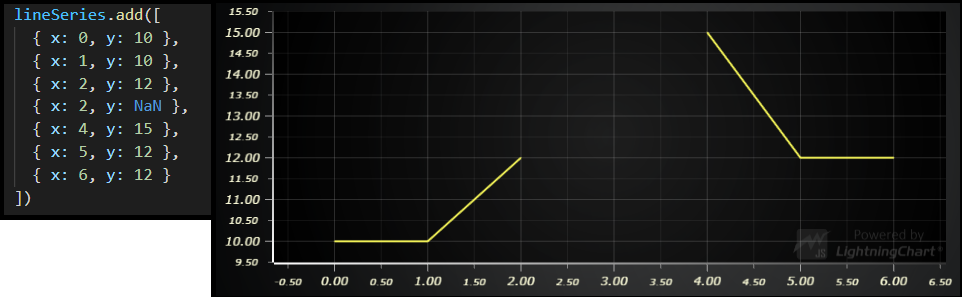
The code of this example shows one way of automatically detecting gaps in data sets and adding the NaN data points in. By default it looks for 1 hour difference between two data points, but this can be easily modified.