Close Editor Run Reset Auto Update CJS /*
* In-depth example of map dashboard with data drill-down. Visualizes relations between CoVID vaccinations and cases
*/
const lcjs = require('@arction/lcjs')
const {
AxisScrollStrategies,
AxisTickStrategies,
emptyTick,
AutoCursorModes,
FormattingFunctions,
LUT,
lightningChart,
UIElementBuilders,
UILayoutBuilders,
PointShape,
ColorCSS,
ColorRGBA,
emptyFill,
PalettedFill,
SolidFill,
emptyLine,
synchronizeAxisIntervals,
translatePoint,
transparentFill,
UIOrigins,
MouseStyles,
SolidLine,
UIDraggingModes,
Themes,
regularColorSteps,
} = lcjs
const dashboardRows = 4
// NOTE: Using `Dashboard` is no longer recommended for new applications. Find latest recommendations here: https://lightningchart.com/js-charts/docs/basic-topics/grouping-charts/
const dashboard = lightningChart().Dashboard({
numberOfColumns: 1,
numberOfRows: dashboardRows,
// theme: Themes.darkGold,
})
const theme = dashboard.getTheme()
// NOTE: Only affects 1 country view (full drill down)
let showRelativeValuesState = true
const lutNewCasesPerMillion = new LUT({
interpolate: true,
steps: [
{ value: -1, color: ColorRGBA(0, 0, 0) },
{ value: -0.1, color: ColorRGBA(0, 0, 0) },
...regularColorSteps(0, 1000, theme.examples.badGoodColorPalette.reverse()),
],
})
const lutPeopleVaccinatedPerHundred = new LUT({
interpolate: true,
steps: [
{ value: -1, color: ColorRGBA(0, 0, 0) },
{ value: -0.1, color: ColorRGBA(0, 0, 0) },
...regularColorSteps(0, 100, theme.examples.badGoodColorPalette.reverse()),
],
})
const highValueThresholds = {
new_cases_per_million: 1000,
hosp_patients_per_million: 100,
icu_patients_per_million: 50,
}
const drillDownRoutes = {
World: [
{
mapType: 'NorthAmerica',
boundary: {
bottomLeft: { x: 0.04, y: 0.52 },
topRight: { x: 0.44, y: 0.93 },
},
},
{
mapType: 'SouthAmerica',
boundary: {
bottomLeft: { x: 0.16, y: 0.14 },
topRight: { x: 0.45, y: 0.5 },
},
},
{
mapType: 'Europe',
boundary: {
bottomLeft: { x: 0.45, y: 0.64 },
topRight: { x: 0.6, y: 0.93 },
},
},
{
mapType: 'Africa',
boundary: {
bottomLeft: { x: 0.46, y: 0.15 },
topRight: { x: 0.63, y: 0.64 },
},
},
{
mapType: 'Asia',
boundary: {
bottomLeft: { x: 0.59, y: 0.4 },
topRight: { x: 0.95, y: 0.91 },
},
},
],
}
const drillDownTip = dashboard
.addUIElement(UILayoutBuilders.Column, dashboard.coordsRelative)
.setOrigin(UIOrigins.RightTop)
.setBackground((background) => background.setFillStyle(emptyFill).setStrokeStyle(emptyLine))
const drillDownTipIn = drillDownTip
.addElement(UIElementBuilders.TextBox)
.setTextFont((font) => font.setSize(10))
.setText('Left click to drill down at mouse location')
const drillDownTipOut = drillDownTip
.addElement(UIElementBuilders.TextBox)
.setTextFont((font) => font.setSize(10))
.setText('Double left click to zoom out')
const drillDownOutButton = dashboard
.addUIElement(UIElementBuilders.TextBox, dashboard.coordsRelative)
.setOrigin(UIOrigins.LeftTop)
.setText('Zoom out')
.setTextFont((font) => font.setSize(20))
.setDraggingMode(UIDraggingModes.notDraggable)
.setMouseStyle(MouseStyles.Point)
dashboard.onResize(() => {
const dbBounds = dashboard.engine.container.getBoundingClientRect()
drillDownTip.setPosition({ x: dbBounds.width - 8, y: dbBounds.height - 40 })
drillDownOutButton.setPosition({ x: 8, y: dbBounds.height - 8 })
})
;(async () => {
let covidData
let vaccinationData
let countriesData
await Promise.all([
new Promise(async (resolve) => {
console.time('loading covid data')
covidData = await fetch(
new URL(document.head.baseURI).origin +
new URL(document.head.baseURI).pathname +
'examples/assets/1111/owid-covid-data.json',
).then((r) => r.json())
console.timeEnd('loading covid data')
resolve()
}),
new Promise(async (resolve) => {
console.time('loading covid vaccinations data')
vaccinationData = await fetch(
new URL(document.head.baseURI).origin + new URL(document.head.baseURI).pathname + 'examples/assets/1111/vaccinations.json',
).then((r) => r.json())
console.timeEnd('loading covid vaccinations data')
resolve()
}),
new Promise(async (resolve) => {
console.time('loading country locations data')
countriesData = await fetch(
new URL(document.head.baseURI).origin + new URL(document.head.baseURI).pathname + 'examples/assets/1111/countries.json',
).then((r) => r.json())
console.timeEnd('loading country locations data')
resolve()
}),
])
let totalCasesTimelineView
const newCasesHistoryDataTimeStart = new Date(2020, 10, 1).getTime()
const activateTotalCasesTimelineView = () => {
console.time('calculate new cases history')
const newCasesHistoryDataMap = new Map()
const vaccinatedHistoryDataMap = new Map()
for (const countryCode of Object.keys(covidData)) {
const countryCovidData = covidData[countryCode]
for (let i = 0; i < countryCovidData.data.length; i += 1) {
const sample = countryCovidData.data[i]
const newCases = sample.new_cases
if (newCases !== undefined) {
const curSum = newCasesHistoryDataMap.get(sample.date)
if (curSum) {
newCasesHistoryDataMap.set(sample.date, curSum + newCases)
} else {
newCasesHistoryDataMap.set(sample.date, newCases)
}
}
}
const countryVaccinationData = vaccinationData.find((item) => item.iso_code === countryCode)
for (let i = 0; i < countryVaccinationData.data.length; i += 1) {
const sample = countryVaccinationData.data[i]
const peopleVaccinatedPerHundred = sample.people_vaccinated_per_hundred
if (peopleVaccinatedPerHundred !== undefined) {
const cur = vaccinatedHistoryDataMap.get(sample.date)
if (cur) {
cur.count += 1
cur.sum += peopleVaccinatedPerHundred
} else {
vaccinatedHistoryDataMap.set(sample.date, { count: 1, sum: peopleVaccinatedPerHundred })
}
}
}
}
const newCasesHistoryDataXY = Array.from(newCasesHistoryDataMap.entries())
.map(([dateIso, newCases]) => ({
x: ISODateToTime(dateIso),
y: newCases,
}))
.filter((point) => point.x >= newCasesHistoryDataTimeStart)
.sort((a, b) => a.x - b.x)
const vaccinatedPerHundredHistoryDataXY = Array.from(vaccinatedHistoryDataMap.entries())
.map(([dateIso, value]) => ({
x: ISODateToTime(dateIso),
y: value.sum / value.count,
}))
.filter((point) => point.x >= newCasesHistoryDataTimeStart)
.sort((a, b) => a.x - b.x)
newCasesHistoryDataMap.clear()
vaccinatedHistoryDataMap.clear()
const timelineChart = dashboard
.createChartXY({
columnIndex: 0,
rowIndex: 1,
})
.setTitle('Global CoVID daily new cases history')
.setAutoCursorMode(AutoCursorModes.disabled)
.setMouseInteractions(false)
const timeLineHighlighterAxis = timelineChart
.addAxisX({ opposite: true })
.setTickStrategy(AxisTickStrategies.Empty)
.setStrokeStyle(emptyLine)
.setMouseInteractions(false)
const timeLineHighlighter = timeLineHighlighterAxis
.addCustomTick(UIElementBuilders.PointableTextBox)
.setMouseInteractions(true)
.setAllocatesAxisSpace(false)
.setTextFormatter((time) => new Date(time).toLocaleDateString('fin', {}))
synchronizeAxisIntervals(timelineChart.getDefaultAxisX(), timeLineHighlighterAxis)
timelineChart
.addLineSeries({ dataPattern: { pattern: 'ProgressiveX' } })
.setCursorInterpolationEnabled(false)
.add(newCasesHistoryDataXY)
timelineChart
.getDefaultAxisY()
.setMouseInteractions(false)
.setTitle('New daily cases')
.setTitleFont((font) => font.setSize(12))
.setTickStrategy(AxisTickStrategies.Numeric, (ticks) => ticks.setFormattingFunction(FormattingFunctions.NumericUnits))
.fit(false)
const axisVaccinated = timelineChart
.addAxisY({ opposite: true })
.setTitle('Vaccinated once (%)')
.setTitleFont((font) => font.setSize(12))
.setMouseInteractions(false)
.setInterval({ start: 0, end: 100 })
timelineChart
.addLineSeries({ dataPattern: { pattern: 'ProgressiveX' }, yAxis: axisVaccinated })
.setCursorInterpolationEnabled(false)
.add(vaccinatedPerHundredHistoryDataXY)
.setStrokeStyle(
new SolidLine({
thickness: 2,
fillStyle: new PalettedFill({
lookUpProperty: 'y',
lut: lutPeopleVaccinatedPerHundred,
}),
}),
)
timelineChart.getDefaultAxisX().setTickStrategy(AxisTickStrategies.DateTime).setMouseInteractions(false).fit(false)
timeLineHighlighter.onMouseDrag((_, event) => {
const locationAxis = timelineChart.translateCoordinate(event, timelineChart.coordsAxis)
const displayTimeNew = Math.min(Math.max(locationAxis.x, newCasesHistoryDataTimeStart), tMax)
timeLineHighlighter.setValue(displayTimeNew)
if (totalCasesTimelineView.onChange) {
totalCasesTimelineView.onChange(displayTimeNew)
}
})
timeLineHighlighter.onMouseEnter((_, e) => {
timelineChart.engine.setMouseStyle(MouseStyles.Horizontal)
})
timeLineHighlighter.onMouseLeave((_, e) => {
timelineChart.engine.setMouseStyle(MouseStyles.Default)
})
console.timeEnd('calculate new cases history')
totalCasesTimelineView = {
chart: timelineChart,
highlighter: timeLineHighlighter,
onChange: () => {},
deactivate: () => {
timelineChart.dispose()
totalCasesTimelineView = undefined
},
}
return totalCasesTimelineView
}
let activeDisplayedTime = new Date(2022, 2, 11)
let tMax = ISODateToTime(covidData['FIN'].data[covidData['FIN'].data.length - 1].date)
let tLastMapViewChange = 0
const activateMapView = async (mapType) => {
tLastMapViewChange = window.performance.now()
totalCasesTimelineView = totalCasesTimelineView || activateTotalCasesTimelineView()
// Drill down available
drillDownTipIn.setVisible(true)
if (mapType !== 'World') {
// Return view available
drillDownTipOut.setVisible(true)
drillDownOutButton.setVisible(true)
} else {
drillDownTipOut.setVisible(false)
drillDownOutButton.setVisible(false)
}
dashboard.setRowHeight(0, 4).setRowHeight(1, 1)
for (let i = 2; i < dashboardRows; i += 1) {
dashboard.setRowHeight(i, 0)
}
const mapChart = dashboard
.createMapChart({
columnIndex: 0,
rowIndex: 0,
type: mapType,
})
.setAutoCursorMode(AutoCursorModes.disabled)
.setMouseInteractions(false)
.setPadding({ top: 40 })
const mapChartXY = dashboard
.createChartXY({
columnIndex: 0,
rowIndex: 0,
})
.setTitle('')
.setBackgroundFillStyle(transparentFill)
.setSeriesBackgroundFillStyle(transparentFill)
.setSeriesBackgroundStrokeStyle(emptyLine)
.setAutoCursorMode(AutoCursorModes.disabled)
.setMouseInteractions(false)
mapChartXY.forEachAxis((axis) => axis.setTickStrategy(AxisTickStrategies.Empty).setStrokeStyle(emptyLine))
mapChart.onViewChange((view) => {
mapChartXY.setPadding({
left: view.margin.left,
right: view.margin.right,
top: view.margin.top,
bottom: view.margin.bottom,
})
mapChartXY.getDefaultAxisX().setInterval({
start: view.longitudeRange.start,
end: view.longitudeRange.end,
})
mapChartXY.getDefaultAxisY().setInterval({
start: view.latitudeRange.start,
end: view.latitudeRange.end,
})
})
mapChart.setFillStyle(
new PalettedFill({
lut: lutPeopleVaccinatedPerHundred,
}),
)
const scatterSeries = mapChartXY
.addPointSeries({ pointShape: PointShape.Circle })
.setIndividualPointSizeEnabled(true)
.setIndividualPointValueEnabled(true)
.setPointFillStyle(new PalettedFill({ lut: lutNewCasesPerMillion }))
.setMouseInteractions(false)
const setDisplayTime = (time, updateTimeLineBand = false) => {
activeDisplayedTime = time
const timeNumber = time.getTime()
const timeIso = dateToIsoString(time)
mapChart.setTitle(`CoVID vaccinations & new cases | ${time.toLocaleDateString('fin', {})}`)
scatterSeries.clear()
mapChart.invalidateRegionValues((region, prev) => {
const countryCode = region.ISO_A3
const countryCovidData = covidData[countryCode]
const countryVaccinationData = vaccinationData.find((item) => item.iso_code === countryCode)
const countryInformation = countriesData.find((item) => item.cca3 === countryCode)
if (countryCovidData && countryVaccinationData && countryInformation) {
const covidSample = countryCovidData.data.find((sample) => sample.date === timeIso)
const smoothedNewCasesPerMillion = covidSample && covidSample.new_cases_smoothed_per_million
let peopleVaccinatedPerHundred
for (let i = countryVaccinationData.data.length - 1; i >= 0; i -= 1) {
const vaccinationSample = countryVaccinationData.data[i]
if (vaccinationSample.people_vaccinated_per_hundred !== undefined) {
const sampleDateTime = ISODateToTime(vaccinationSample.date)
if (sampleDateTime <= timeNumber) {
peopleVaccinatedPerHundred = vaccinationSample.people_vaccinated_per_hundred
break
}
}
}
if (smoothedNewCasesPerMillion !== undefined && peopleVaccinatedPerHundred !== undefined) {
// Add point to scatter chart.
const latitude = countryInformation.latlng[0]
const longitude = countryInformation.latlng[1]
const pointSize =
smoothedNewCasesPerMillion === 0
? 0
: clampNumber((25 * smoothedNewCasesPerMillion) / 1000, mapType === 'World' ? 1 : 5, 25)
scatterSeries.add({
countryCode,
smoothedNewCasesPerMillion,
peopleVaccinatedPerHundred,
x: longitude,
y: latitude,
value: smoothedNewCasesPerMillion,
size: pointSize,
})
// Return value is used for map region coloring.
return peopleVaccinatedPerHundred
}
}
return -1
})
if (updateTimeLineBand && totalCasesTimelineView) {
// Update displayed time line position.
totalCasesTimelineView.highlighter.setValue(time.getTime())
}
}
setDisplayTime(activeDisplayedTime, true)
let shouldUpdateTimeRange
totalCasesTimelineView.onChange = (value) => {
shouldUpdateTimeRange = new Date(value)
}
const intervalUpdateTimeRange = setInterval(() => {
if (shouldUpdateTimeRange) {
setDisplayTime(shouldUpdateTimeRange)
shouldUpdateTimeRange = undefined
}
}, 1000 / 60)
const container = document.getElementById('chart-container') || document.body
const containerOverlayCursor = document.createElement('div')
container.append(containerOverlayCursor)
const chartOverlayCursor = lightningChart()
.ChartXY({
container: containerOverlayCursor,
theme,
})
.setTitle('')
.setPadding({ left: 0, bottom: 0, right: 0, top: 14 })
.setMouseInteractions(false)
.setBackgroundFillStyle(theme.cursorResultTableFillStyle)
chartOverlayCursor
.setBackgroundFillStyle(emptyFill)
.setBackgroundStrokeStyle(emptyLine)
.setSeriesBackgroundFillStyle(emptyFill)
.setSeriesBackgroundStrokeStyle(emptyLine)
chartOverlayCursor.engine.setBackgroundFillStyle(emptyFill)
chartOverlayCursor.getDefaultAxisY().dispose()
chartOverlayCursor.getDefaultAxisX().setAnimationScroll(false)
const chartOverlayUi = chartOverlayCursor
.addUIElement(UILayoutBuilders.Column)
.setPosition({ x: 0, y: 100 })
.setOrigin(UIOrigins.LeftTop)
.setBackground((background) => background.setStrokeStyle(emptyLine).setFillStyle(emptyFill))
const ChartOverlayItem = (text) => chartOverlayUi.addElement(UIElementBuilders.TextBox).setText(text)
const chartOverlayTitle = ChartOverlayItem('')
if (!theme.isDark) {
chartOverlayTitle.setTextFillStyle(new SolidFill({ color: ColorCSS('rgb(255,255,255)') }))
}
const ChartOverlaySeries = (colorCss, label, highValue, format, dataSet) => {
const fill = new SolidFill({ color: ColorCSS(colorCss) })
const yAxis = chartOverlayCursor
.addAxisY()
.setInterval({ start: 0, end: highValue, stopAxisAfter: false })
.setScrollStrategy(AxisScrollStrategies.expansion)
return {
series: chartOverlayCursor
.addLineSeries({ yAxis, dataPattern: { pattern: 'ProgressiveX' } })
.setCursorInterpolationEnabled(false)
.setStrokeStyle((stroke) => stroke.setFillStyle(fill)),
label: ChartOverlayItem(label).setTextFillStyle(fill),
valueLabel: chartOverlayCursor
.addUIElement(UIElementBuilders.TextBox, {
x: chartOverlayCursor.getDefaultAxisX(),
y: yAxis,
})
.setOrigin(UIOrigins.RightBottom)
.setTextFillStyle(fill)
.setText('')
.setBackground((background) => background.setStrokeStyle(emptyLine).setFillStyle(emptyFill)),
format,
dataSet,
}
}
const chartOverlaySeries = {
people_vaccinated_per_hundred: ChartOverlaySeries(
'rgb(0, 255, 0)',
'Vaccinations',
100,
(sample) =>
sample.people_vaccinated_per_hundred !== undefined ? `${sample.people_vaccinated_per_hundred.toFixed(1)}%` : undefined,
vaccinationData,
),
new_cases_per_million: ChartOverlaySeries(
'rgb(255, 255, 0)',
'New cases',
highValueThresholds.new_cases_per_million,
(sample) => (sample.new_cases !== undefined ? String(sample.new_cases) : undefined),
covidData,
),
hosp_patients_per_million: ChartOverlaySeries(
'rgb(255, 127, 0)',
'Hospitalized',
highValueThresholds.hosp_patients_per_million,
(sample) => (sample.hosp_patients !== undefined ? String(sample.hosp_patients) : undefined),
covidData,
),
icu_patients_per_million: ChartOverlaySeries(
'rgb(255, 0, 0)',
'Severe cases',
highValueThresholds.icu_patients_per_million,
(sample) => (sample.icu_patients !== undefined ? String(sample.icu_patients) : undefined),
covidData,
),
}
const overlayCursorWidth = 280
const overlayCursorHeight = 200
containerOverlayCursor.style.position = 'absolute'
containerOverlayCursor.style.top = '0px'
containerOverlayCursor.style.backgroundColor = 'rgba(0,0,0,0.7)'
containerOverlayCursor.style.border = 'solid 8px transparent'
containerOverlayCursor.style.borderRadius = '16px'
containerOverlayCursor.style.width = `${overlayCursorWidth}px`
containerOverlayCursor.style.height = `${overlayCursorHeight}px`
containerOverlayCursor.style.transition = 'left 0.2s, top 0.2s, opacity 0.5s'
containerOverlayCursor.style.opacity = '0.0'
containerOverlayCursor.style.pointerEvents = 'none'
chartOverlayCursor.forEachAxis((axis) =>
axis.setTickStrategy(AxisTickStrategies.Empty).setStrokeStyle(emptyLine).setMouseInteractions(false),
)
let cursorTarget
let cursorActiveCountry
let cursorLastPointedCountry
mapChart.onMapDataReady(() => {
setTimeout(() => {
cursorTarget = { countryCode: 'ITA', x: 12.83, y: 42.83 }
}, 500)
})
mapChartXY.onSeriesBackgroundMouseMove((_, event) => {
const nearest = scatterSeries.solveNearestFromScreen(event)
if (nearest) {
cursorTarget = nearest.location
cursorLastPointedCountry = cursorTarget.countryCode
}
})
mapChartXY.onSeriesBackgroundMouseLeave(() => {
cursorActiveCountry = undefined
cursorTarget = undefined
})
const intervalUpdateCursor = setInterval(() => {
if (cursorTarget && cursorTarget.countryCode !== cursorActiveCountry) {
const locationWebpage = mapChartXY.translateCoordinate(cursorTarget, mapChartXY.coordsAxis, mapChartXY.coordsClient)
const containerBounds = container.getBoundingClientRect()
containerOverlayCursor.style.left = `${Math.max(
locationWebpage.clientX - (overlayCursorWidth + 10 + containerBounds.left),
10,
)}px`
containerOverlayCursor.style.top = `${Math.max(
locationWebpage.clientY - (overlayCursorHeight + 10 + containerBounds.top),
10,
)}px`
containerOverlayCursor.style.opacity = '1.0'
chartOverlayCursor.engine.layout()
const showTimeHistoryDays = 30
const countryCovidData = covidData[cursorTarget.countryCode]
const countryVaccinationData = vaccinationData.find((item) => item.iso_code === cursorTarget.countryCode)
const countryInformation = countriesData.find((item) => item.cca3 === cursorTarget.countryCode)
chartOverlayTitle.setText(`${countryInformation.name.common} previous 4 weeks`)
const checkISODateInRange = createISODateRangeMatcher(
new Date(activeDisplayedTime.getTime() - showTimeHistoryDays * 24 * 60 * 60 * 1000),
activeDisplayedTime,
)
const covidSamplesInRange = countryCovidData.data.filter((sample) => checkISODateInRange(sample.date))
const vaccinationSamplesInRange = countryVaccinationData.data.filter((sample) => checkISODateInRange(sample.date))
for (const key of Object.keys(chartOverlaySeries)) {
const { series, valueLabel, dataSet, format } = chartOverlaySeries[key]
const samplesInRange = dataSet === covidData ? covidSamplesInRange : vaccinationSamplesInRange
const data = samplesInRange
.map((sample) => ({
x: ISODateToTime(sample.date),
y: sample[key] !== undefined ? sample[key] : NaN,
}))
.filter((sample) => !Number.isNaN(sample.y))
series.clear().add(data)
let lastValue
for (let i = data.length - 1; i >= 0; i -= 1) {
lastValue = data[i]
if (!Number.isNaN(lastValue.y)) {
break
}
}
valueLabel.setText('')
if (lastValue !== undefined) {
let valueLabelText
for (let i = samplesInRange.length - 1; i >= 0; i -= 1) {
valueLabelText = format(samplesInRange[i])
if (valueLabelText) break
}
if (valueLabelText) {
const valueLabelPosition = { x: lastValue.x, y: lastValue.y }
valueLabel.setText(valueLabelText).setPosition(valueLabelPosition)
}
}
}
cursorActiveCountry = cursorTarget.countryCode
}
cursorTarget = undefined
if (!cursorActiveCountry) {
containerOverlayCursor.style.opacity = '0.0'
}
}, 1000 / 60)
detectMouseClicks(
mapChartXY.onSeriesBackgroundMouseClick.bind(mapChartXY),
mapChartXY.onSeriesBackgroundMouseDoubleClick.bind(mapChartXY),
(e) => {
if (window.performance.now() - tLastMapViewChange < 750) {
return
}
// Attempt drill down at mouse location.
const locationRelative = mapChartXY.translateCoordinate(e, mapChartXY.coordsRelative)
const chartSize = mapChartXY.getSizePixels()
const locationPercentage = { x: locationRelative.x / chartSize.x, y: locationRelative.y / chartSize.y }
const routes = drillDownRoutes[mapType] || []
// Attempt to drill down to a smaller map view.
for (const route of routes) {
if (
locationPercentage.x >= route.boundary.bottomLeft.x &&
locationPercentage.x <= route.boundary.topRight.x &&
locationPercentage.y >= route.boundary.bottomLeft.y &&
locationPercentage.y <= route.boundary.topRight.y
) {
disposeChart()
activateMapView(route.mapType)
return
}
}
// Drill down to nearest country
if (cursorLastPointedCountry) {
disposeChart()
activateCountryView(cursorLastPointedCountry, mapType, showRelativeValuesState)
}
},
(e) => {
if (window.performance.now() - tLastMapViewChange > 2000 && mapType !== 'World') {
disposeChart()
activateMapView('World')
}
},
)
const subDrillDownOutButtonClick = drillDownOutButton.onMouseClick((_, e) => {
if (mapType !== 'World' && window.performance.now() - tLastMapViewChange > 500) {
disposeChart()
activateMapView('World')
}
})
let disposeChart = () => {
clearInterval(intervalUpdateCursor)
clearInterval(intervalUpdateTimeRange)
mapChart.dispose()
mapChartXY.dispose()
chartOverlayCursor.dispose()
containerOverlayCursor.remove()
drillDownOutButton.offMouseClick(subDrillDownOutButtonClick)
disposeChart = () => {}
}
}
const activateCountryView = (countryCode, returnView, showRelativeValues) => {
if (totalCasesTimelineView) {
totalCasesTimelineView.deactivate()
}
drillDownTipIn.setVisible(false)
drillDownTipOut.setVisible(true)
drillDownOutButton.setVisible(true)
const countryCovidData = covidData[countryCode]
const countryVaccinationData = vaccinationData.find((item) => item.iso_code === countryCode)
const countryInformation = countriesData.find((item) => item.cca3 === countryCode)
const marginLeft = 80
const Trend = (property, dataSet, title, titleY, maxY, format) => ({
property,
dataSet,
title,
titleY,
maxY,
format,
})
const trends = [
Trend(
'people_vaccinated_per_hundred',
countryVaccinationData,
'Vaccination rate (at least 1 vaccine)',
'Vaccinated (%)',
100,
(value) => `${value.toFixed(1)}% received at least 1 vaccine`,
),
Trend(
showRelativeValues ? 'new_cases_per_million' : 'new_cases',
countryCovidData,
showRelativeValues ? 'New cases (relative to population)' : 'New cases',
showRelativeValues ? 'per 1 million citizens' : 'New cases',
showRelativeValues ? highValueThresholds.new_cases_per_million : undefined,
showRelativeValues
? (value) => `${value.toFixed(0)} new cases per 1 million citizens`
: (value) => `${value.toFixed(0)} new cases`,
),
Trend(
showRelativeValues ? 'hosp_patients_per_million' : 'hosp_patients',
countryCovidData,
showRelativeValues ? 'Hospital patients (relative to population)' : 'Hospital patients',
showRelativeValues ? 'per 1 million citizens' : 'Hospital patients',
showRelativeValues ? highValueThresholds.hosp_patients_per_million : undefined,
showRelativeValues
? (value) => `${value.toFixed(0)} hospital patients per 1 million citizens`
: (value) => `${value.toFixed(0)} hospital patients`,
),
Trend(
showRelativeValues ? 'icu_patients_per_million' : 'icu_patients',
countryCovidData,
showRelativeValues ? 'Intensive hospital care patients (relative to population)' : 'Intensive hospital care patients',
showRelativeValues ? 'per 1 million citizens' : 'Intensive care patients',
showRelativeValues ? highValueThresholds.icu_patients_per_million : undefined,
showRelativeValues
? (value) => `${value.toFixed(0)} intensive care patients per 1 million citizens`
: (value) => `${value.toFixed(0)} intensive care patients`,
),
].map((trend, iTrend, _trends) => {
const chart = dashboard
.createChartXY({
columnIndex: 0,
rowIndex: iTrend,
})
.setTitle(trend.title)
.setPadding({ left: 0 })
if (iTrend === 0) {
const dashboardTitle = chart
.addUIElement(UIElementBuilders.TextBox, chart.coordsRelative)
.setText(`${countryInformation.name.common}`)
.setTextFont((font) => font.setSize(22))
.setBackground((background) => background.setFillStyle(emptyFill).setStrokeStyle(emptyLine))
chart.onResize(() => {
dashboardTitle.setPosition({ x: 140, y: chart.getSizePixels().y }).setOrigin(UIOrigins.LeftTop)
})
// Add selector for displaying relative / actual values.
const selector = chart
.addUIElement(UIElementBuilders.TextBox)
.setPosition({ x: 100, y: 100 })
.setOrigin(UIOrigins.RightTop)
.setMargin({ top: 14, right: 24 })
.setDraggingMode(UIDraggingModes.notDraggable)
selector.onMouseEnter((_) => chart.engine.setMouseStyle(MouseStyles.Point))
selector.onMouseLeave((_) => chart.engine.setMouseStyle(MouseStyles.Default))
const setState = (displayRelative) => {
if (displayRelative !== showRelativeValuesState) {
showRelativeValuesState = displayRelative
// Reload view
disposeChart()
activateCountryView(countryCode, returnView, displayRelative)
}
selector.setText(displayRelative ? 'Show actual values' : 'Show relative values')
}
selector.onMouseClick((_) => setState(!showRelativeValuesState))
setState(showRelativeValuesState)
}
const axisX = chart.getDefaultAxisX().setAnimationScroll(false)
if (iTrend < _trends.length - 1) {
axisX
.setMouseInteractions(false)
.setThickness(0)
.setStrokeStyle(emptyLine)
.setTickStrategy(AxisTickStrategies.DateTime, (ticks) =>
ticks
.setGreatTickStyle(emptyTick)
.setMajorTickStyle((major) => major.setLabelFillStyle(transparentFill).setTickStyle(emptyLine))
.setMinorTickStyle((minor) => minor.setLabelFillStyle(transparentFill).setTickStyle(emptyLine)),
)
} else {
axisX.setTickStrategy(AxisTickStrategies.DateTime)
}
const axisY = chart
.getDefaultAxisY()
.setTitle(trend.titleY || '')
.setTitleFont((font) => font.setSize(12))
.setThickness({ min: marginLeft })
if (trend.maxY !== undefined) {
axisY.setInterval({ start: 0, end: trend.maxY, stopAxisAfter: false }).setScrollStrategy(AxisScrollStrategies.expansion)
}
const series = chart
.addLineSeries({
dataPattern: { pattern: 'ProgressiveX' },
})
.setName(`${countryInformation.name.common}`)
.setCursorInterpolationEnabled(false)
.setCursorResultTableFormatter((builder, _, x, y, dataPoint) =>
builder.addRow(`${countryInformation.name.common}`).addRow(axisX.formatValue(dataPoint.x)).addRow(trend.format(y)),
)
const dataXY = trend.dataSet.data
.map((sample) => ({
x: ISODateToTime(sample.date),
y: sample[trend.property],
}))
.filter((point) => point.y !== undefined && point.x >= newCasesHistoryDataTimeStart)
series.add(dataXY)
const averageData = averagesData && averagesData[trend.property]
let seriesAverage
if (averageData) {
seriesAverage = chart
.addLineSeries({
dataPattern: { pattern: 'ProgressiveX' },
})
.setName('Global average')
.setCursorInterpolationEnabled(false)
.setCursorResultTableFormatter((builder, _, x, y, dataPoint) =>
builder.addRow(`Global average`).addRow(axisX.formatValue(dataPoint.x)).addRow(trend.format(y)),
)
.add(averageData)
const styleNormal = series.getStrokeStyle()
seriesAverage.setStrokeStyle(styleNormal.setFillStyle(styleNormal.getFillStyle().setA(100)))
}
return { ...trend, chart, series, seriesAverage }
})
synchronizeAxisIntervals(...trends.map((trend) => trend.chart.getDefaultAxisX()))
for (let i = 0; i < dashboardRows; i += 1) {
dashboard.setRowHeight(i, i < trends.length ? 1 : 0)
}
const returnPreviousView = () => {
if (disposeChart) {
disposeChart()
}
activateMapView(returnView)
}
trends.forEach((trend) => {
detectMouseClicks(
trend.chart.onSeriesBackgroundMouseClick.bind(trend.chart),
trend.chart.onSeriesBackgroundMouseDoubleClick.bind(trend.chart),
(e) => {},
returnPreviousView,
)
detectMouseClicks(
trend.chart.onBackgroundMouseClick.bind(trend.chart),
trend.chart.onBackgroundMouseDoubleClick.bind(trend.chart),
(e) => {},
returnPreviousView,
)
})
const subDrillDownOutButtonClick = drillDownOutButton.onMouseClick(() => returnPreviousView())
let disposeChart = () => {
trends.forEach((trend) => {
trend.chart.dispose()
})
drillDownOutButton.offMouseClick(subDrillDownOutButtonClick)
disposeChart = undefined
}
tLastMapViewChange = window.performance.now()
}
let averagesData
console.time('calculate global averages')
averagesData = {
new_cases_per_million: [],
hosp_patients_per_million: [],
icu_patients_per_million: [],
}
for (const key of Object.keys(averagesData)) {
const dataMap = new Map()
for (const countryCode of Object.keys(covidData)) {
const countryData = covidData[countryCode]
if (!countryData) {
continue
}
for (let i = 0; i < countryData.data.length; i += 1) {
const sample = countryData.data[i]
const curValue = sample[key]
if (curValue !== undefined) {
const cur = dataMap.get(sample.date)
if (cur) {
cur.count += 1
cur.sum += curValue
} else {
dataMap.set(sample.date, { count: 1, sum: curValue })
}
}
}
}
const dataXY = Array.from(dataMap.entries())
.map(([dateIso, newCases]) => ({
x: ISODateToTime(dateIso),
y: newCases.sum / newCases.count,
}))
.sort((a, b) => a.x - b.x)
.filter((point) => point.x >= newCasesHistoryDataTimeStart)
averagesData[key] = dataXY
}
console.timeEnd('calculate global averages')
activateMapView('World')
})()
const createISODateRangeMatcher = (dateStart, dateEnd) => {
const yStart = dateStart.getFullYear()
const mStart = dateStart.getMonth()
const dStart = dateStart.getDate()
const yEnd = dateEnd.getFullYear()
const mEnd = dateEnd.getMonth()
const dEnd = dateEnd.getDate()
const tMonth = 31
const tYear = tMonth * 12
const tStart = yStart * tYear + mStart * tMonth + dStart
const tEnd = yEnd * tYear + mEnd * tMonth + dEnd
return (isoDate) => {
const y = Number(isoDate.substring(0, 4))
const m = Number(isoDate.substring(5, 7)) - 1
const d = Number(isoDate.substring(8, 10))
const t = y * tYear + m * tMonth + d
const result = t >= tStart && t <= tEnd
return result
}
}
const ISODateToTime = (isoString) => {
const y = Number(isoString.substring(0, 4))
const m = Number(isoString.substring(5, 7)) - 1
const d = Number(isoString.substring(8, 10))
return new Date(y, m, d).getTime()
}
const dateToIsoString = (date) => {
return `${date.getFullYear()}-${integerToFixedLengthString(date.getMonth() + 1, 2)}-${integerToFixedLengthString(date.getDate(), 2)}`
}
const integerToFixedLengthString = (num, len) => {
let str = String(num)
while (str.length < len) {
str = `0${str}`
}
return str
}
const detectMouseClicks = (onMouseClick, onMouseDoubleClick, handleSingleClick, handleDoubleClick) => {
let tLastDoubleClick = 0
onMouseClick((_, e) => {
setTimeout(() => {
if (window.performance.now() - tLastDoubleClick >= 500) {
handleSingleClick(e)
}
}, 200)
})
onMouseDoubleClick((_, e) => {
tLastDoubleClick = window.performance.now()
handleDoubleClick(e)
})
}
const clampNumber = (num, min, max) => Math.min(Math.max(num, min), max)
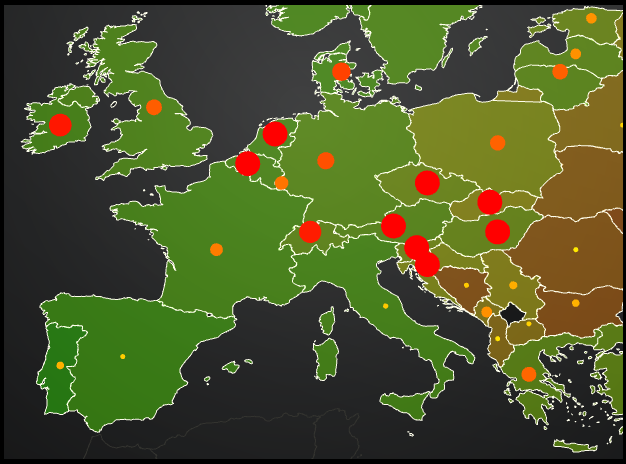
JavaScript Drill-Down CoVID Map Dashboard - Editor LightningChart JS example which showcases combination of MapChart and ChartXY features to implement a multi-dimensional data visualization. Amount of new CoVID cases in each country are displayed with a bubble (size and color represents number of new cases), while country color represents the vaccination coverage in the country (1 or more vaccines).
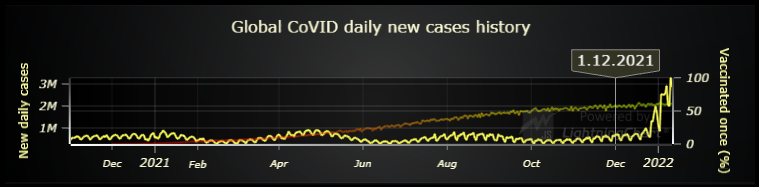
The global number of daily cases as well as average vaccination coverage is displayed at the bottom. The active date that is displayed in the main chart above can be changed by dragging on the slider.
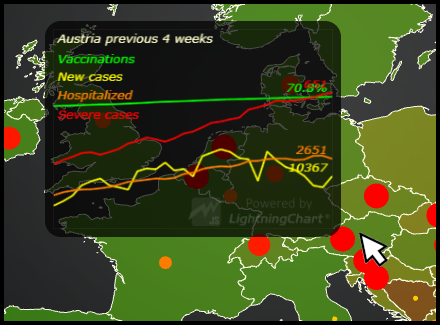
By placing mouse cursor above the main chart, a popup chart will be displayed over the nearest country from the mouse location. This chart shows the previous 4 weeks data from the active date. Depending on availability, the following data will be shown:
Vaccination coverage (1 vaccination, % of country population) New CoVID cases (graph displays number relative to population, while label displays actual number of cases) Hospitalized CoVID patients (graph displays number relative to population, while label displays actual number of patients) Intensive care CoVID patients (graph displays number relative to population, while label displays actual number of patients) The idea behind measurements relative to population is that the readings can be compared between countries, even if they might have different number of citizens.
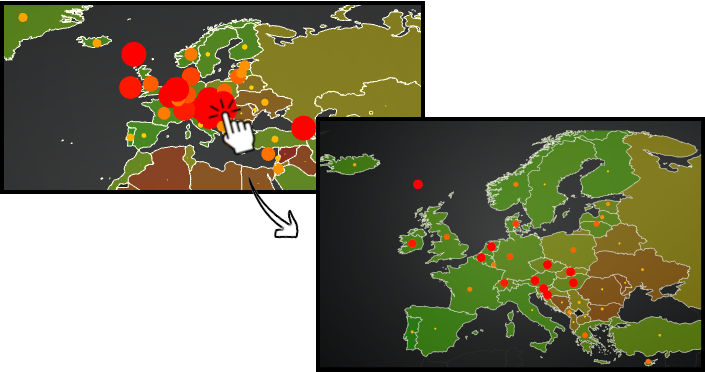
Drill-down to data
By left-clicking once, you can drill down around the mouse location. For example, clicking around the Europe area will zoom the map view into just Europe. Further more, you can drill down into a single country to show the full historical progression of that country's CoVID data.
In this view you can also compare a single country's data to the calculated average from available global data.
Zooming back out can be done by double left-clicking.
Data sources
General CoVID data is from the openly accessible Owid Covid dataset found in GitHub .
CoVID Vaccine data is referenced from the work of Hasell, J., Mathie, E., Beltekia, D. et al. A cross-country database of COVID-19 testing. Sci Data 7, 345 (2020).
Contains information from World countries by Modammed Le Doze , which is made available here under the Open Database License (ODbL) .
More map examples :