/*
* LightningChartJS example that showcases a simple XY line series.
*/
// Import LightningChartJS
const lcjs = require('@arction/lcjs')
// Extract required parts from LightningChartJS.
const { lightningChart, ColorCSS, PointShape, SolidLine, SolidFill, Themes } = lcjs
const { createProgressiveTraceGenerator } = require('@arction/xydata')
const chart = lightningChart()
.ChartXY({
// theme: Themes.darkGold
})
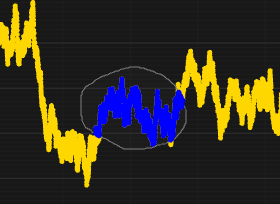
.setTitle('Custom lasso interaction (drag Left mouse button)')
// Disable default chart interactions with left mouse button.
.setMouseInteractionRectangleFit(false)
.setMouseInteractionRectangleZoom(false)
// Add series for displaying data set.
const pointSeries = chart.addPointSeries({
pointShape: PointShape.Circle,
})
// Add another series for displaying highlighted data points.
const seriesHighlightedPoints = chart
.addPointSeries({ pointShape: PointShape.Circle })
.setCursorEnabled(false)
.setMouseInteractions(false)
.setPointFillStyle(new SolidFill({ color: ColorCSS('blue') }))
// Add a Polygon series and 1 polygon figure for displaying "Lasso" on user interactions.
const polygonSeries = chart.addPolygonSeries().setCursorEnabled(false).setMouseInteractions(false)
const polygonFigure = polygonSeries
.add([])
.setFillStyle(new SolidFill({ color: ColorCSS('gray').setA(10) }))
.setStrokeStyle(
new SolidLine({
thickness: 1,
fillStyle: new SolidFill({ color: ColorCSS('gray') }),
}),
)
// Hide polygon initially.
.setVisible(false)
// Generate random example data.
createProgressiveTraceGenerator()
.setNumberOfPoints(10000)
.generate()
.toPromise()
.then((data) => {
pointSeries.add(data)
// * Add custom interactions to Chart events for lasso data selection interaction *
// Array that keeps track of current coordinates in polygon figure (lasso).
const lassoCheckedCoordinates = []
// Separate Array that keeps track of new lasso coordinates, that haven't been checked for covered data points yet.
const lassoNewCoordinates = []
// Lasso updates are handled after a timeout to avoid cases where the custom interaction code causes the entire chart application to perform bad.
// Generally it is not recommended to do heavy calculations directly inside event handlers!
let lassoUpdateTimeout = undefined
// When Left mouse button is dragged inside series area, Lasso should be shown and selected data points highlighted.
chart.onSeriesBackgroundMouseDrag((_, event, button) => {
// If not left mouse button, don't do anything.
if (button !== 0) return
// Translate mouse location to Axis coordinate system.
const curLocationAxis = chart.translateCoordinate(event, chart.coordsAxis)
// Add location to list of new coordinates and schedule an update to the lasso.
lassoNewCoordinates.push(curLocationAxis)
// Don't update lasso any more frequently than every 25ms.
lassoUpdateTimeout = lassoUpdateTimeout || setTimeout(updateLasso, 25)
})
// Reset previous lasso when mouse drag action is started.
chart.onSeriesBackgroundMouseDragStart((_, __, button) => {
// If not left mouse button, don't do anything.
if (button !== 0) return
lassoCheckedCoordinates.length = 0
lassoNewCoordinates.length = 0
seriesHighlightedPoints.clear()
polygonFigure.setVisible(false)
pointSeries.setCursorEnabled(false)
})
chart.onSeriesBackgroundMouseDragStop(() => {
pointSeries.setCursorEnabled(true)
})
/**
* Function which updates the lasso and highlighted points.
*/
const updateLasso = () => {
const lassoCheckedCoordinatesLength = lassoCheckedCoordinates.length
const lassoNewCoordinatesLength = lassoNewCoordinates.length
if (lassoNewCoordinatesLength > 0 && lassoCheckedCoordinatesLength + lassoNewCoordinatesLength >= 3) {
// * Highlight data points that are inside the lasso area *
// Intersection checks are always done relative to first polygon coordinate.
const triangleA = lassoCheckedCoordinatesLength > 0 ? lassoCheckedCoordinates[0] : lassoNewCoordinates[0]
// Consider only new triangles of the lasso coordinates, starting from the last checked coordinate,
// and ending with the last new unchecked coordinate.
let triangleB =
lassoCheckedCoordinatesLength > 0 ? lassoCheckedCoordinates[lassoCheckedCoordinatesLength - 1] : lassoNewCoordinates[1]
for (let iTriangle = 0; iTriangle < lassoNewCoordinates.length; iTriangle += 1) {
const triangleC = lassoNewCoordinates[iTriangle]
for (const point of data) {
if (checkPointInsideTriangle(point, triangleA, triangleB, triangleC)) {
// The data point is inside the lasso -> highlight it.
seriesHighlightedPoints.add(point)
}
}
triangleB = triangleC
}
// Append new coordinates to complete list of lasso coordinates.
lassoCheckedCoordinates.push.apply(lassoCheckedCoordinates, lassoNewCoordinates)
lassoNewCoordinates.length = 0
// Ensure lasso is visible.
polygonFigure.setVisible(true).setDimensions(lassoCheckedCoordinates)
}
lassoUpdateTimeout = undefined
}
/**
* Highly optimized routine for checking if a XY point is inside a triangle defined by 3 XY points.
*/
const checkPointInsideTriangle = (position, triangleA, triangleB, triangleC) => {
const dX = position.x - triangleC.x
const dY = position.y - triangleC.y
const dX21 = triangleC.x - triangleB.x
const dY12 = triangleB.y - triangleC.y
const s = dY12 * dX + dX21 * dY
const t = (triangleC.y - triangleA.y) * dX + (triangleA.x - triangleC.x) * dY
const D = dY12 * (triangleA.x - triangleC.x) + dX21 * (triangleA.y - triangleC.y)
if (D < 0) return s <= 0 && t <= 0 && s + t >= D
return s >= 0 && t >= 0 && s + t <= D
}
})
This example showcases the creation of a custom user interaction.
By default, dragging left mouse inside the series area, a zoom/fit interaction is activated. This default interaction can be disabled:
chart
// Disable default chart interactions with left mouse button..setMouseInteractionRectangleFit(false).setMouseInteractionRectangleZoom(false)
And any custom interaction can be implemented with different event subscription methods. In this example, ChartXY.onSeriesBackgroundMouseDrag is used to hook on to the event when user drags their left mouse button inside the series area. PolygonSeries are used to draw a freeform lasso selection as the user moves their mouse on the chart.
The data points that are inside the lasso are solved in real-time, and highlighted with a separate PointSeries.
This idea of custom interactions can be extended to any application specific dynamic interaction, like deleting selected points, displaying them in a separate chart or moving them - imagination is the limit!
When implementing custom interactions that involve solving a list of data points from some selection - like lasso - optimizing the application side code is very important. Performing heavy computations inside event handlers can block the thread which can make it seem like the chart is not performing well when in reality it is the application code that is bottle-necking the performance.
Some rules of thumb for implementing custom interactions:
Don't do heavy calculations directly inside event handlers. Instead, schedule an update using setTimeout and prevent recalculations happening more often than necessary. This example limits the lasso update to max. 1 update per 25 milliseconds.
Work smart, not hard. In the case of lasso selection, iterating over a large data set one-by-one and checking which points are inside a polygon can be really heavy. Instead, on each update, we only check the new expanded polygon area. In practice, the lasso polygon often has even 1000 coordinates in which case we're skipping 999 iterations of the entire data set every time the lasso is updated.
The code in this example is optimized very well, feel free to reference it in your own custom interaction implementations!