Gauge chart with value indicators
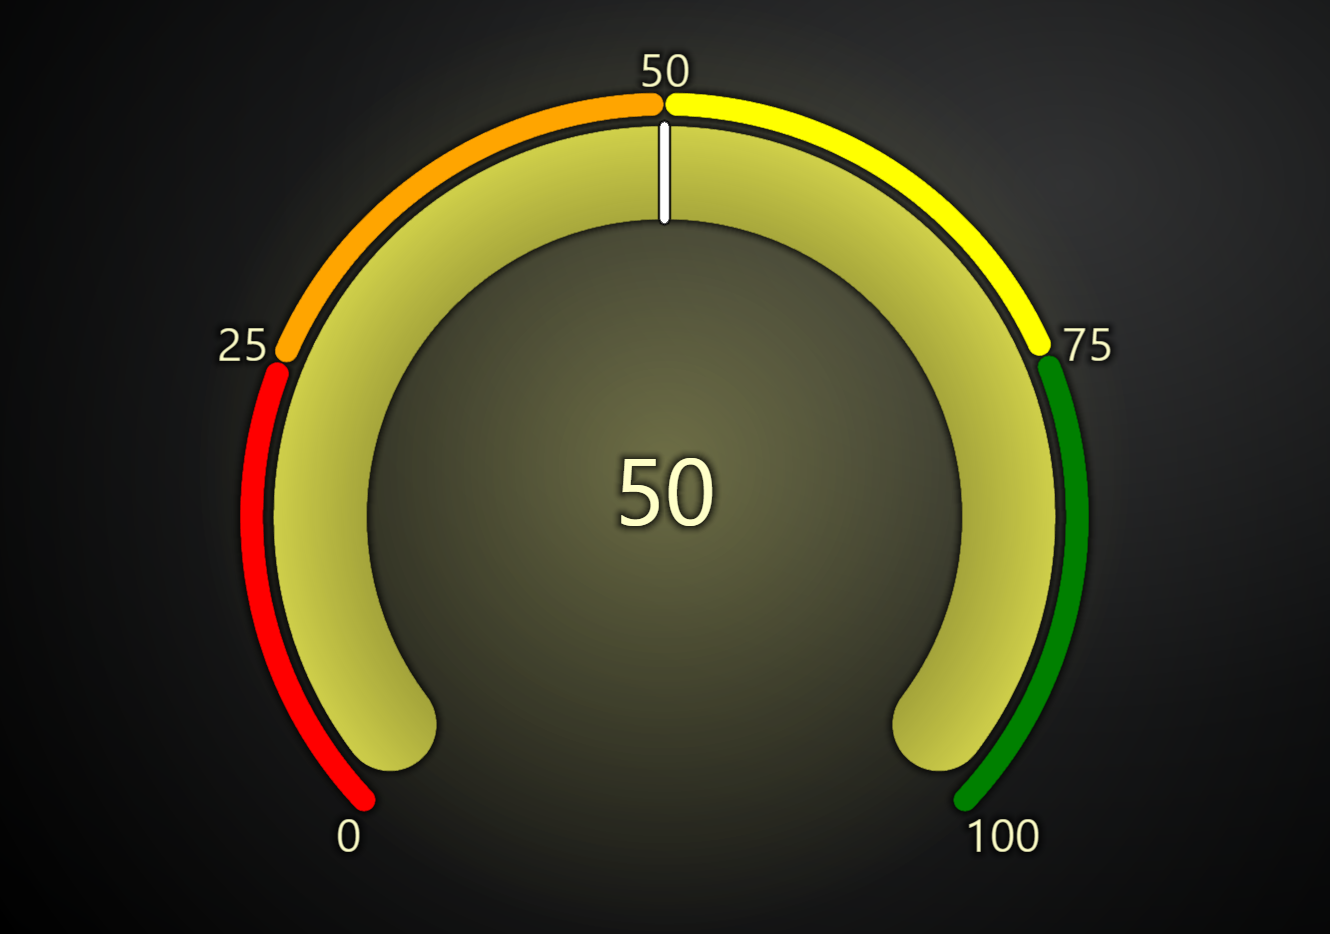
This example shows the use of value indicators in a gauge chart.
Value indicators are elements to highlight additional value ranges in addition to the main gauge value interval.
Each value indicator must have a start value, an end value, and a color.
gauge.setValueIndicators([
    { start: 0, end: 25, color: ColorCSS('red') },
    { start: 25, end: 50, color: ColorCSS('orange') },
    { start: 50, end: 75, color: ColorCSS('yellow') },
    { start: 75, end: 100, color: ColorCSS('green') },
])
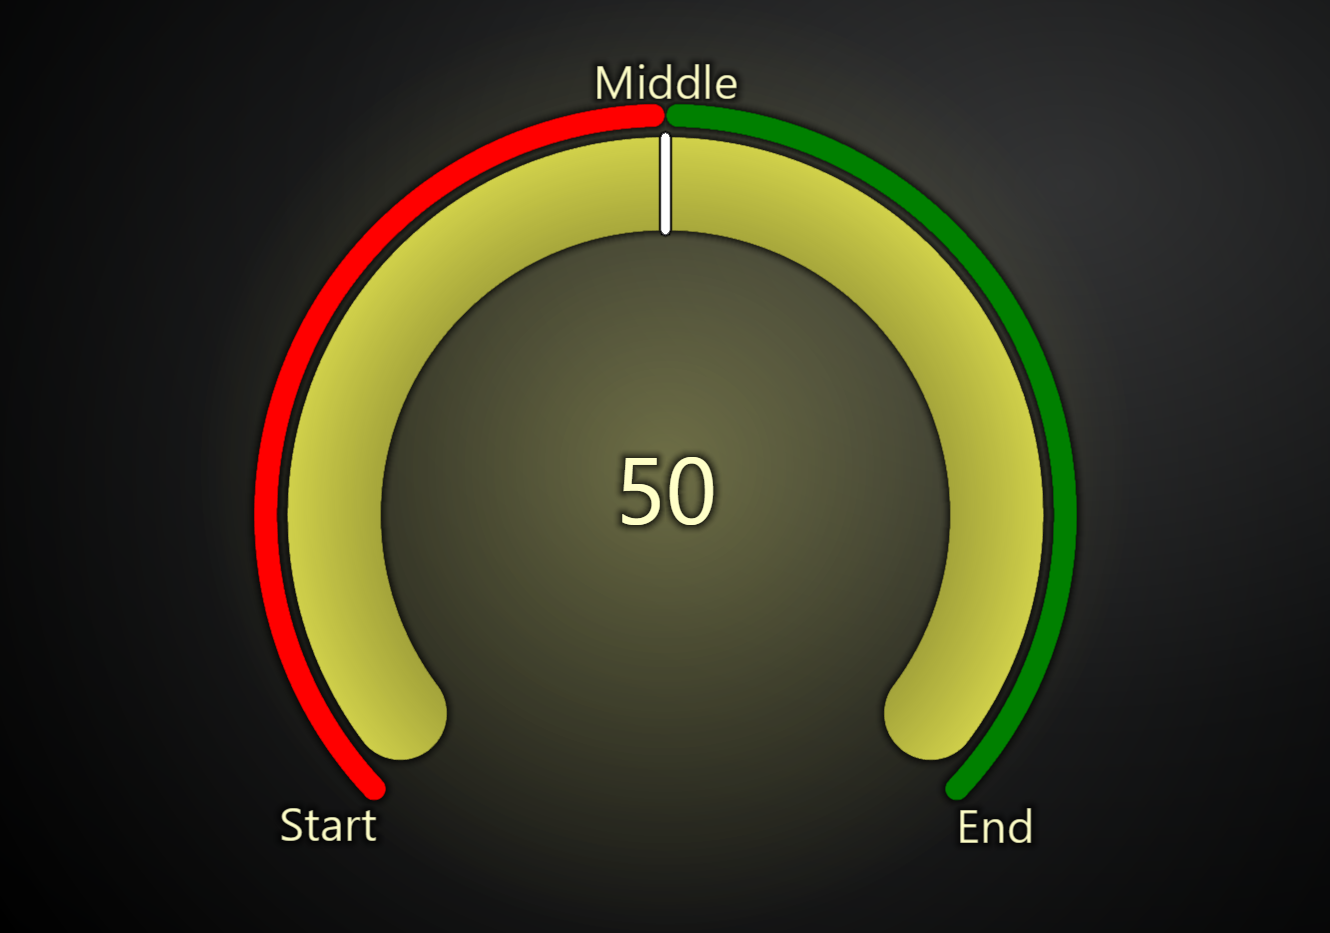
Value indicator labels can be also overridden:
gauge.setValueIndicators([
    { start: 0, end: 50, color: ColorCSS('red'), startLabel: 'Start', endLabel: '' },
    { start: 50, end: 100, color: ColorCSS('green'), startLabel: 'Middle', endLabel: 'End' },
])
To hide the default gauge labels:
gauge.setTickFormatter((value) => {
    if (value === gauge.getInterval().start || value === gauge.getInterval().end) {
        return ''
    }
    return `${value}`
})