Close Editor Run Reset Auto Update CJS /*
* Histogram of world population by age per year.
*/
const lcjs = require('@lightningchart/lcjs')
const { lightningChart, PalettedFill, ColorRGBA, AxisTickStrategies, LUT, emptyFill, Themes } = lcjs
const chart = lightningChart()
.Chart3D({
// theme: Themes.darkGold,
})
.setBoundingBox({ x: 0.7, y: 0.5, z: 1 })
.setTitle('Real-Time Airplane Temperature')
chart
.getDefaultAxes()
.forEach((axis) =>
axis.setTickStrategy(AxisTickStrategies.Numeric, (ticks) =>
ticks
.setMajorTickStyle((major) => major.setLabelFillStyle(emptyFill))
.setMinorTickStyle((minor) => minor.setLabelFillStyle(emptyFill)),
),
)
fetch(new URL(document.head.baseURI).origin + new URL(document.head.baseURI).pathname + 'examples/assets/1502/air.obj')
.then((response) => response.text())
.then((data) => {
const model = chart.addMeshModel().setScale(0.0025).setModelFromObj(data).setHighlightOnHover(false).setName('Airplane temperature')
const palette = new PalettedFill({
lookUpProperty: 'value',
lut: new LUT({
units: '°C',
interpolate: true,
steps: [
{ value: 0, color: ColorRGBA(0, 150, 255) },
{ value: 20, color: ColorRGBA(0, 255, 0) },
{ value: 40, color: ColorRGBA(200, 255, 0) },
{ value: 50, color: ColorRGBA(255, 255, 0) },
{ value: 60, color: ColorRGBA(255, 200, 0) },
{ value: 100, color: ColorRGBA(255, 130, 0) },
{ value: 120, color: ColorRGBA(255, 0, 0) },
],
}),
})
model.setFillStyle(palette)
const sensors = [
// Engines close to the body
{ initValue: 90, value: 100, x: -0.252, y: -0.175, z: -0.25 },
{ initValue: 90, value: 100, x: 0.252, y: -0.175, z: -0.25 },
// Engines far from the body
{ initValue: 110, value: 100, x: -0.52, y: -0.145, z: -0.07 },
{ initValue: 110, value: 100, x: 0.52, y: -0.145, z: -0.07 },
// Nose of the plane
{ initValue: 20, value: 20, x: 0, y: -0.1, z: -1 },
// Back of the plane
{ initValue: 50, value: 50, x: 0, y: -0.04, z: 0.97 },
// Body ?
{ initValue: 20, value: 20, x: 0, y: -0.1, z: -0.5 },
{ initValue: 20, value: 20, x: 0, y: -0.1, z: 0 },
{ initValue: 0, value: 0, x: 0, y: -0.1, z: 0.5 },
]
// Skip first frame to avoid possible initial lag
requestAnimationFrame(() => {
// Initialize an empty array to store information about each vertex's relationship with sensors.
const vertexCoordSensorWeights = []
// Set vertex values using a callback function.
model.setVertexValues((coordsWorld) => {
const vertexValues = []
// Loop through the world coordinates of each vertex.
for (let i = 0; i < coordsWorld.length; i += 1) {
// Convert the vertex's world coordinates into axis coordinates.
const locAxis = chart.translateCoordinate(coordsWorld[i], chart.coordsWorld, chart.coordsAxis)
// Create an array to store sensor weights.
const sensorWeights = new Array(sensors.length).fill(0)
let sumOfWeights = 0
// Calculate distances and weights for each sensor.
sensors.forEach((sensor, i2) => {
const locationDeltaX = sensor.x - locAxis.x
const locationDeltaY = sensor.y - locAxis.y
const locationDeltaZ = sensor.z - locAxis.z
const dist = Math.sqrt(locationDeltaX ** 2 + locationDeltaY ** 2 + locationDeltaZ ** 2)
const weight = dist !== 0 ? 1 / dist ** 3 : 1
sensorWeights[i2] = weight
sumOfWeights += weight
})
// Store sum of weights and sensor weights for each vertex.
vertexCoordSensorWeights.push({ sumOfWeights, sensorWeights })
// Calculate vertex value based on sensor values and weights.
const vertexValue = sensors.reduce((prev, cur, i2) => prev + cur.value * sensorWeights[i2], 0) / sumOfWeights || 20
// Push the vertex value to the array.
vertexValues.push(vertexValue)
}
// Return the array of vertex values.
return vertexValues
})
// Animation frame function.
const frame = () => {
// Update sensor values for animation.
sensors.forEach((sensor, i) => {
sensor.value = sensor.initValue + 10 * Math.sin(window.performance.now() / 500)
})
const vertexValues = []
// Update vertex values using a callback function.
model.setVertexValues((vertex) => {
for (let i = 0; i < vertex.length; i += 1) {
const { sumOfWeights, sensorWeights } = vertexCoordSensorWeights[i]
// Calculate vertex value based on sensor values and weights.
const vertexValue = sensors.reduce((prev, cur, i2) => prev + cur.value * sensorWeights[i2], 0) / sumOfWeights || 20
// Push the vertex value to the array.
vertexValues.push(vertexValue)
}
// Return the updated array of vertex values.
return vertexValues
})
// Request the next animation frame.
requestAnimationFrame(frame)
}
// Start the animation.
frame()
})
})
Dynamic coloring of 3D Mesh Model. - Editor This example demonstrates how to visualize 3D mesh models with customized coloring using the setVertexValues() method and PalettedFill.
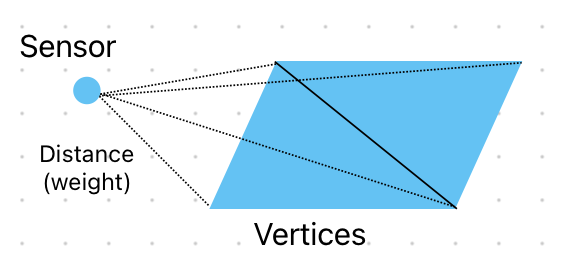
To apply color to your 3D model using PalettedFill, you'll need to set values for each vertex.
First, every vertex of the model is iterated, and a weight for every sensor is calculated for that vertex.
This weight essentially describes how close to the vertex every sensor is.
Then, the sensor values are changed in real-time, and the vertex values are re-interpolated every time they do to update the colors.
This can be achieved by calling the setVertexValues() method, which accepts a callback function as an argument. This callback function should take a vertex as a parameter and return an array of colored values based on your criteria.