LightningChart .NET charts
LightningChart® .NET charts outperforms all the competition when it comes to performance. Our development team at LightningChart has invested years in research to create the most powerful graphical API for .NET charting applications, which utilizes custom low-level graphical routines with no compromises on high-level usability.
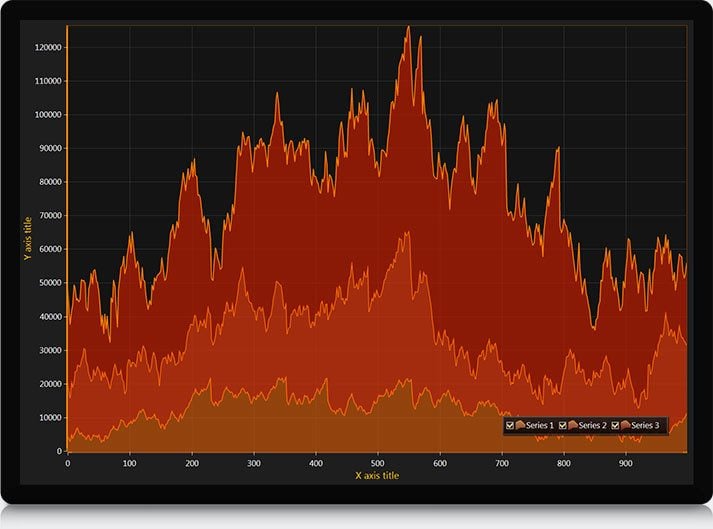
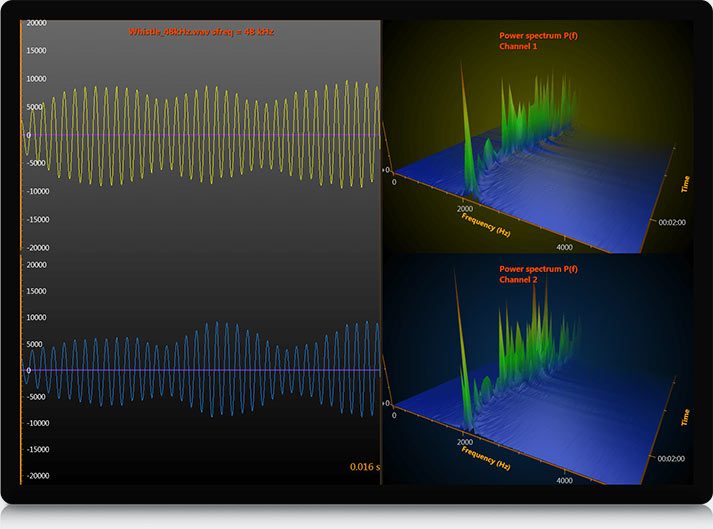
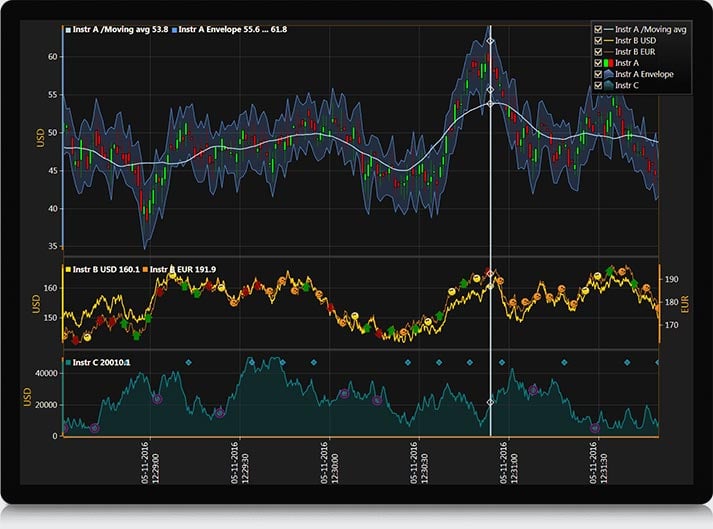
LightningChart comes with .NET charts for WPF, UWP and Windows Forms. Whichever API you choose, you are getting access to a great number of graph types, including 2D XY graph, 3D XYZ, polar, 3D pie/donut views and volume rendering. Using any of these graph types is as simple as drag-n-dropping LightningChart component from the Visual Studio toolbox to your app’s form and configuring it via the XAML or code.
.NET Charts and LightningChart
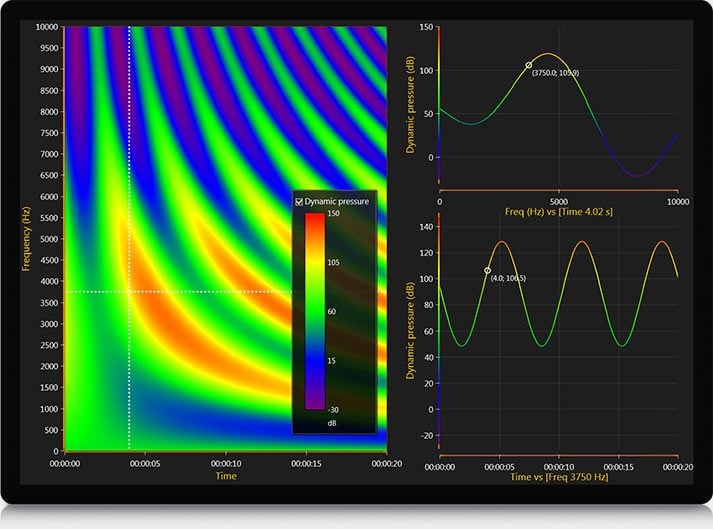
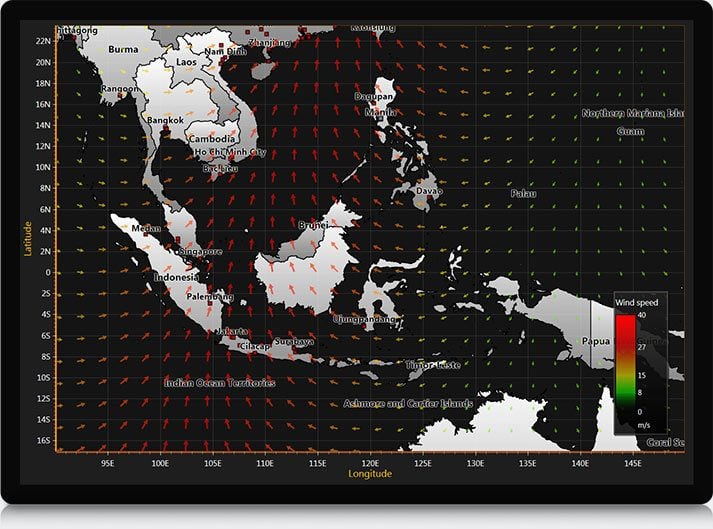
Out of the box, LightningChart offers customizable and easy-to-setup solutions for professional real-time measurement and monitoring, such as high-speed data acquisition software, PC-based oscilloscopes and signal analyzers, G.I.S., medical, and other .NET chart applications.
LighningChart also provides full technical support for developers as well as for trial users. Additionally, introductory videos and tutorials can be found on our support page alongside rich documentation material and forum community support.
Try LightningChart .NET now, and start building .NET Charts with the fastest application in the industry!
LightningChart Features:
- Massive data set support
- Entirely GPU accelerated
- Real-time data monitoring optimization
- Superior 2D and 3D rendering performance
- Full touch compatibility
- Online and offline maps out of the box
- Volume rendering feature
- Audio I/O components included
LightningChart .NET
Do you need advanced .NET data visualization components? Take a look at LightningChart .NET charts, the fastest and most advanced WPF, UWP & WinForms data visualization toolkit ever made.
If you have any questions, feel free to contact us!