LightningChart .NETCreating a Smith Charts Data Visualization Application
TutorialStep-by-step tutorial how to create your own Smith Chart application with LightningChart .NET library
Smith Charts
The Smith chart is a diagram designed for the study and resolution of problems with transmission lines. This diagram is aimed at electrical and electronic engineers specializing in radio frequency. These types of diagrams are common in most radio frequency circuit analysis software.
Today, we’ll build an interactive example of a smith chart application tutorial, using the LightningChart .NET tools. We will start by giving a brief introduction to downloading and installing the framework and applying interactive examples of LightningChart.
Project Overview
Today, we’re showcasing how to develop an interactive Smith chart application using LightningChart .NET. Similar to previous .NET articles, we’ll go step-by-step from setting up your LightningChart .NET license, project setup in Visual Studio, and running the final application.
It’s worth saying that LightningChart .NET offers several UI elements that can be later customized to your own liking.
With that being said, let’s look at what you’ll create:
Download the project to follow the tutorial
Local Setup
For this project, we need to take in count the following requirements to compile the project.
-
OS: 32-bit or 64-bit Windows Vista or later, Windows Server 2008 R2 or later.
-
DirectX: 9.0c (Shader model 3 and higher) or 11.0 compatible graphics adapter.
-
Visual Studio: 2010-2019 for development, not required for deployment.
-
Platform .NET Framework: installed version 4.0 or newer.
Now go to the next URL and click the download button: http://lightningchart.com/net-charts/

You will be redirected to a sign in form, from then on, the process is very simple to follow. So, after confirming your email, you will have access to your own LightningChart account.
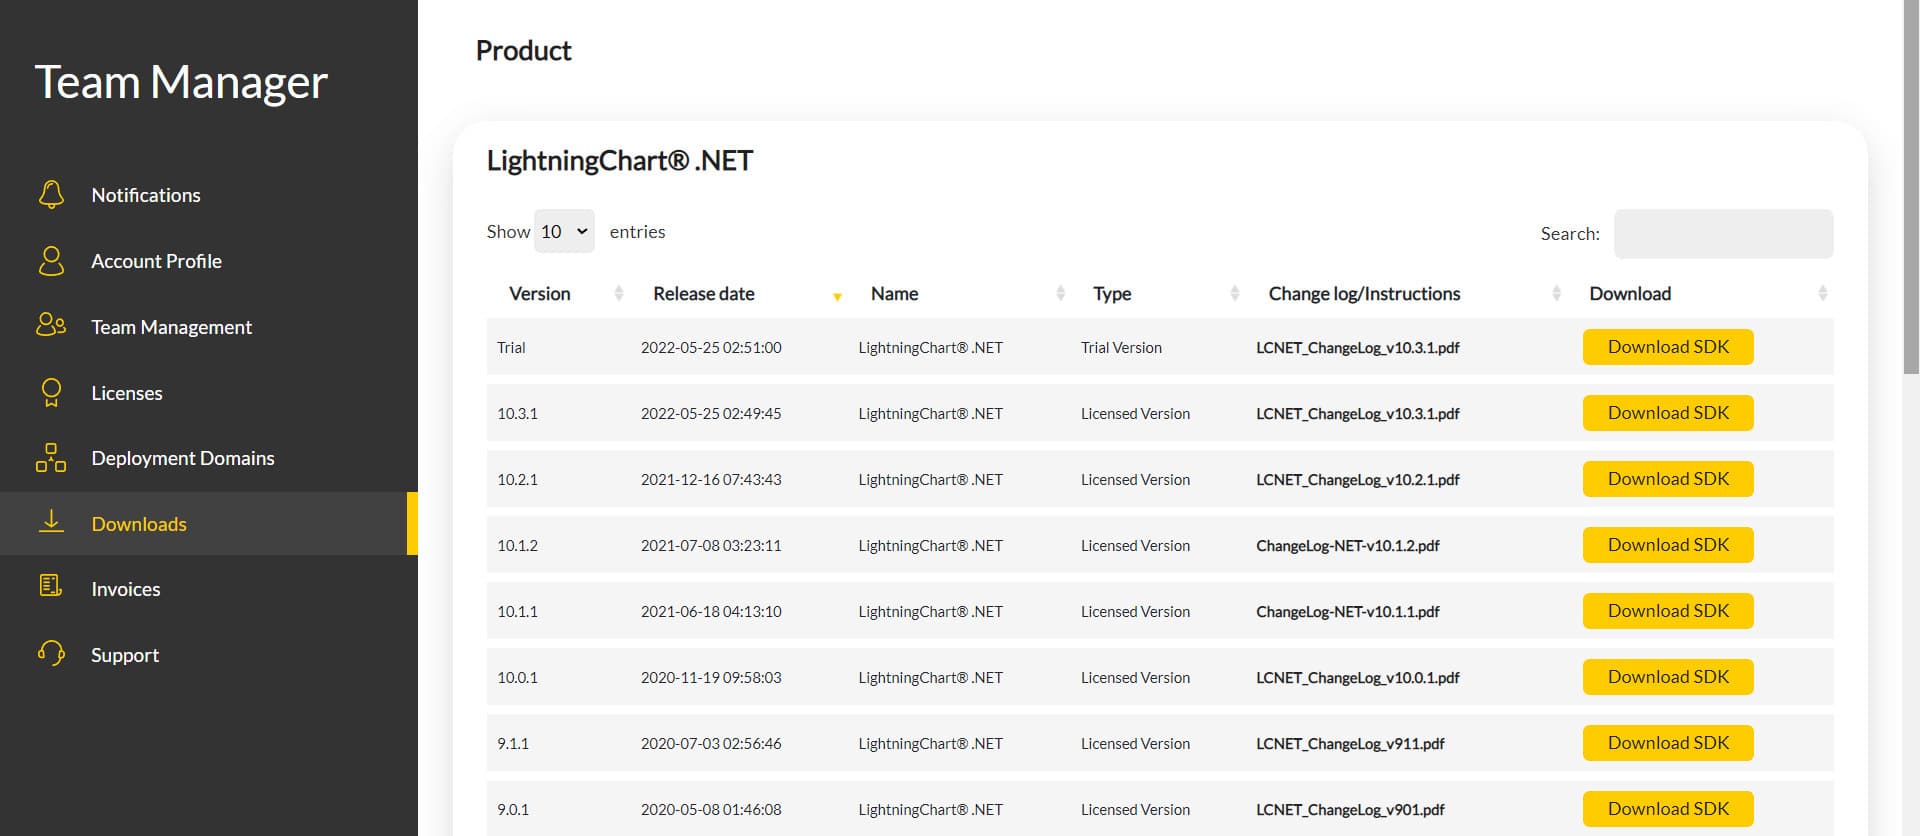
After you sign into your account, you will be able to download the SDK. This SDK will be a "free trial" version, but you will be able to use many important features.
If you download the SDK, you will have an .exe like this:

The installation will be a typical Windows process, so please continue with it until it is finished. After the installation, you will see the following programs:

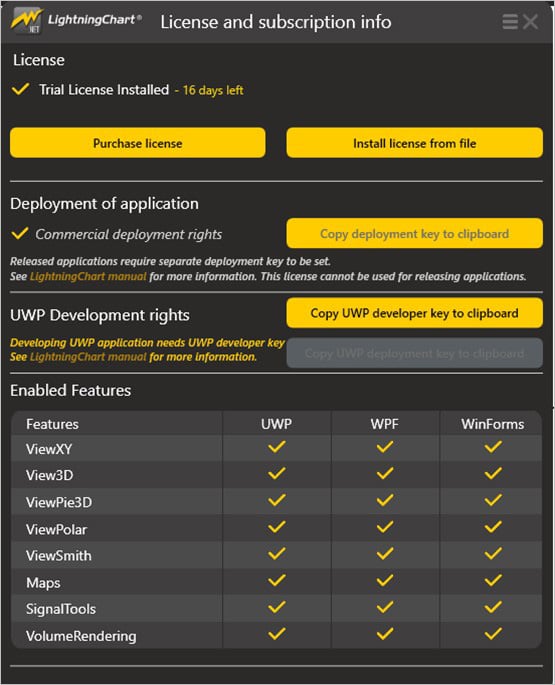
- License Manager: In this application, you will see the purchase options. All the projects that you will create with this trial SDK, will be available for future developments with all features enabled.
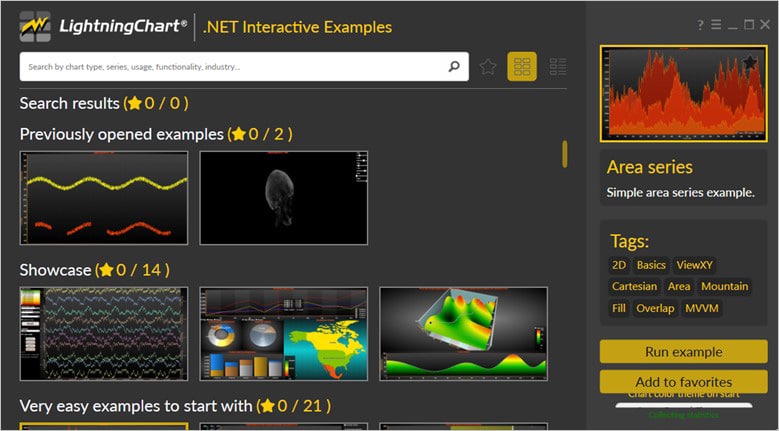
- LightningChart .NET Interactive Examples: now you can see 100+ interactive visualizations available for WPF, WinForms, and/or UWP though today we’re working with Smith Charts.
Visual Studio Project
Now let’s work with visual studio. The main difference between using the LightningChart .NET visualizer and Visual Studio, is that we will be able to analyze and experiment with many features in the source code. In the LC visualizer, select the Smith Line Chart and run the example:

In the top-right zone of the windows, you will see the following options:
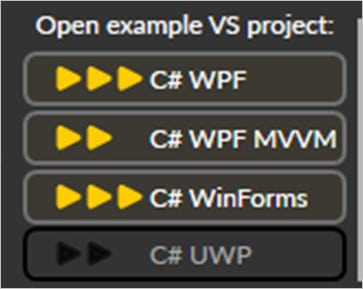
For trial SDK, we will be able to use the WPF and WinForms frameworks. If you are fully related to windows forms, this option will be more comfortable. In this case I will use the Windows Presentation Foundation framework.
After clicked the framework to use, we will need to specify a folder where the project will be created:
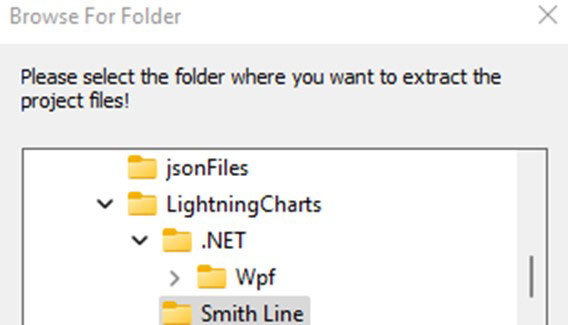
Finally, the project will be created, and the Visual Studio will be opened and ready for execution.
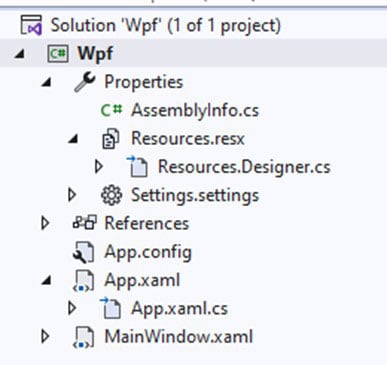
Code Review
The main code will be wrapped inside MainWindow.xaml.cs. Here we will find the code for UI controls.
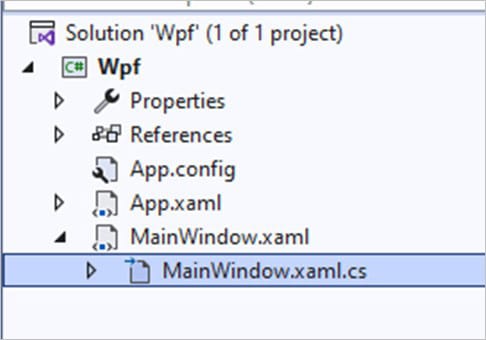
Inside the code we will check two methods that will create the properties that we need to draw correctly the chart.
CreateChart()
This main method will initialize many properties that are provided by the Lightning Chart .NET framework. If you checked our previous JS articles, this part will be familiar.
The great advantage here is, if you have C# knowledge, this syntax will be easier for you.
- _chart: The chart object will contain the Lightning Chart constructor… basically, this will contain a new instance of a chart object.
- _chart – properties:
// Create a new chart.
            _chart = new LightningChart();

            // Disable rendering, strongly recommended before updating chart properties.
            _chart.BeginUpdate();

            // Set optional name for the chart.
            _chart.ChartName = "Smith line chart";

            _chart.ActiveView = ActiveView.ViewSmith;

_chart.ViewSmith.ZoomPanOptions.ZoomPadding = new Thickness(10, 30, 10, 10);- BeginUpdate(): Disables control repaints when updating the status of many properties or updating series points.
- ChartName: Name of the chart.
- ActiveView: Specifies the type of chart by selecting the smith chart form the enumeration class.
- ZoomPadding: Padding affects zooming operations. The empty space left between the zoom area and the margins.
//Add a line series
            PointLineSeriesSmith series = new PointLineSeriesSmith(_chart.ViewSmith, _chart.ViewSmith.Axis)
            {
                PointsVisible = true
            };
            series.PointStyle.Color1 = series.LineStyle.Color;
            series.Title.Text = "System output impedance";
_chart.ViewSmith.PointLineSeries.Add(series);- series: Instance for the PointLineSeriesSmith that will Contain properties for all points within the chart view.
- PointsVisible: Shows the points in the chart.
- Add: All the properties for data points (series instanced class) will be added to the point line series.
- Creating Data Points: To add points to the smith chart application, we need to create an array object for the struct SmithSeriesPoint. The struct needs 2 or 3 parameters (real, imgValue, tag):
- real: Double type. real component.
- imgValue: Double type. The imaginary component of the smith chart coordinate.
- tag: object type. Freely assignable object.
SmithSeriesPoint[] dataPoints = new SmithSeriesPoint[] {
                new SmithSeriesPoint(70, 60, 10000),
                new SmithSeriesPoint(55, 45, 15000),
                new SmithSeriesPoint(45, 37.5, 20000),
                new SmithSeriesPoint(37.5, 30, 25000),
                new SmithSeriesPoint(30, 22, 30000),
                new SmithSeriesPoint(24, 14, 35000),
                new SmithSeriesPoint(21, 9, 40000),
                new SmithSeriesPoint(17.5, 3, 45000),
                new SmithSeriesPoint(14.5, -3, 50000),
                new SmithSeriesPoint(13.5, -9, 55000),
                new SmithSeriesPoint(14, -15, 60000),
                new SmithSeriesPoint(15, -20, 65000),
                new SmithSeriesPoint(17, -25, 70000),
                new SmithSeriesPoint(18, -30, 75000),
                new SmithSeriesPoint(20, -37.5, 80000),
                new SmithSeriesPoint(22, -45, 85000),
            };
series.Points = dataPoints;
The dataPoints array needs to be assigned to the Points array within the series class.
- Creating a marker to act as a data value resolution cursor
PointShapeStyle pss = new PointShapeStyle(null);
            EventMarkerTitle title = new EventMarkerTitle(null)
            {
                Color = Colors.Red,
                Text = "Cursor"
            };
            _cursor = new SmithEventMarker(_chart.ViewSmith, _chart.ViewSmith.Axis, pss,
                1, 0.5, title, new PointInt(0, 0))
            {
                SnapToClosestPoint = RoundEventMarkerBase.MarkerSnapToType.All
            };
            _cursor.SetSnapSeries(series);
            _cursor.Label.Font = new WpfFont("Segoe UI", 16, true, false);
            _cursor.Label.Shadow.Style = TextShadowStyle.HighContrast;
            _cursor.Label.Color = Color.FromArgb(255, 192, 0, 0);
            _cursor.Symbol.Width = _cursor.Symbol.Height = 17;
            _cursor.Symbol.BorderWidth = 2;
            _cursor.Symbol.BorderColor = Colors.Red;
            _cursor.Symbol.Color1 = Colors.Transparent;
            _cursor.Symbol.Color2 = Color.FromArgb(100, 255, 0, 0);
            _cursor.PositionChanged += Cursor_PositionChanged;
            _cursor.Symbol.Shape = Arction.Wpf.Charting.Shape.Circle;

            _cursor.RealValue = dataPoints[2].RealValue;
            _cursor.ImgValue = dataPoints[2].ImgValue;
As we can see in the code above, we can assign style properties to the cursor. All the values are basic UI concepts, if you want to check the rest of the properties, go to the API documentation page.
- Adding axes properties to the chart:
- ReferenceValue: Normalized values are Absolute values / Reference impedance (ohms).
- ShowAbsoluteValues: Determines if the axis shows absolute or normalized values.
- AxisThickness: Thickness of the axis line.
- GridImg: Gridline options for the real-part grid.
- GridReal: Gridline options for the real-part grid.
- LegendBox: Shows description of series.
_chart.ViewSmith.Axis.ReferenceValue = 50; //ohms
            _chart.ViewSmith.Axis.ShowAbsoluteValues = true;
            _chart.ViewSmith.Axis.AxisThickness = 2;
            _chart.ViewSmith.Axis.Title.Visible = false;
            _chart.ViewSmith.Axis.GridImg.LineWidth = 1.1f;
            _chart.ViewSmith.Axis.GridReal.LineWidth = 1.1f;

            _chart.ViewSmith.LegendBox.ShowCheckboxes = false;

            gridChart.Children.Add(_chart);

            //Allow chart rendering
_chart.EndUpdate();-
- gridChart: XAML Grid object.
<Grid Grid.Row="1" Name="gridChart">-
- EndUpdate(): Enables control repaints.
- Updating cursor:
private void Cursor_PositionChanged(object sender, SmithPositionChangedEventArgs e)
        {
            UpdateCursorText(e.NewPosition.RealValue, e.NewPosition.ImgValue);
        }


        /// <summary>
        /// Update cursor text
        /// </summary>
        /// <param name="real">Real value</param>
        /// <param name="img">Imaginary value</param>
        private void UpdateCursorText(double real, double img)
        {
            if (_chart != null)
            {
                _chart.BeginUpdate();
                string strSign = "+";
                if (img < 0)
                {
                    strSign = "-";
                }

                if (radioButtonNormalizedScale.IsChecked == true)
                {
                    double dNormalizedReal = real / _chart.ViewSmith.Axis.ReferenceValue;
                    double dNormalizedImg = img / _chart.ViewSmith.Axis.ReferenceValue;
                    _cursor.Label.Text = "Z = " + dNormalizedReal.ToString("0.00") + " " + strSign + " j" + Math.Abs(dNormalizedImg).ToString("0.00");
                }
                else
                {
                    _cursor.Label.Text = "Z = " + real.ToString("0.0") + " " + strSign + " j" + Math.Abs(img).ToString("0.0") + "Ω";
                }

                _chart.EndUpdate();
            }
        }
For each time the cursor changes its position, the [UpdateCursorText] will be called. The real double value and the IMG value will be divided by the maximum value of the current axis.
The text will convert the results into strings (because the label needs a string). All those properties will work if the radio button of the [Normalized Scale] is selected.
- Radio buttons:
private void RadioButtonCheckedChanged(object sender, RoutedEventArgs e)
        {
            if (_chart == null)
            {
                return;
            }

            _chart.BeginUpdate();

            if (radioButtonAbsoluteScale.IsChecked == true)
            {
                _chart.ViewSmith.Axis.ShowAbsoluteValues = true;
            }
            else
            {
                _chart.ViewSmith.Axis.ShowAbsoluteValues = false;
            }

            UpdateCursorText(_cursor.RealValue, _cursor.ImgValue);

            _chart.EndUpdate();
        }
If the absolute values are checked, this will Determine if the axis shows absolute or normalized values. The [UpdateCursorText] will be called again because this depends on the checked value to draw the grid.
- Dispose:
public void Dispose()
        {
            // Don't forget to clear chart grid child list.
            gridChart.Children.Clear();

            if (_chart != null)
            {
                _chart.Dispose();
                _chart = null;
            }

            // Disposing of unmanaged resources done.
        }
Call this method if you need to stop threads, dispose unmanaged resources, or any other jobs that need to be done before this example object is ready for the garbage collector.
Final Application
We’ve now seen how to create one of the many advanced smith chart examples for impedance representations. As part of the smith chart basics, smith chart tools can help to easily identify any other impedance mismatches. As seen, this is an engineering chart used in radio frequencies and microwave domain studies.
LightningChart .NET facilitates the time to develop by offering high-performance Smith charts of easy development and implementation. The Smith chart application presented includes both absolute and normalized scales with a data cursor, both features can be easily switched on/off using the UI elements.
This chart is featured with 100+ other charting components for WPF, UWP, and WinForms in LightningChart .NET. Other chart types included are XY charts, LineSeries, heatmaps, and more.
We’ve now seen how to create one of the many advanced smith chart examples for impedance representations.
As part of the smith chart basics, smith chart tools can help to easily identify any other impedance mismatches.
As seen, this is an engineering chart used in radio frequencies and microwave domain studies.
LightningChart .NET facilitates the time to develop by offering high-performance Smith charts of easy development and implementation.
The Smith chart application presented includes both absolute and normalized scales with a data cursor, both features can be easily switched on/off using the UI elements.
This chart is featured with 100+ other charting components for WPF, UWP, and WinForms in LightningChart .NET.
Other chart types included are XY charts, LineSeries, heatmaps, and more.


