


GPU Accelerated Charting Controls
LightningChart .NET and JavaScript solutions are built to fulfill the industry's most demanding data visualization requirements with thorough charts optimization, minimal delays, and smooth rendering.
Best Rendering Performance
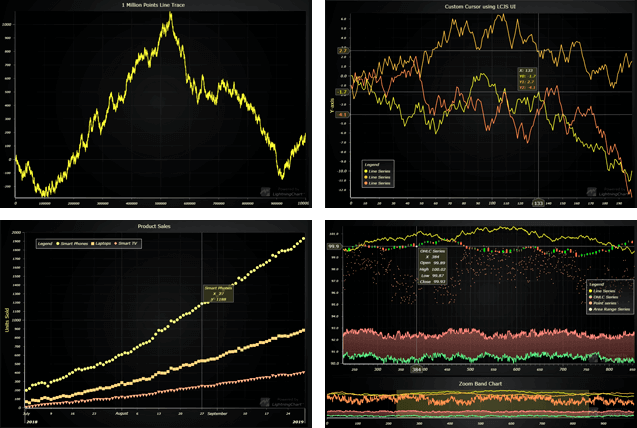
LightningChart for .NET has an outstanding rendering capacity of over 1,000,000,000,000 (1 trillion +) datapoints with just 128GB RAM.
LightningChart for JS has a rendering performance of over 2,000,000,000 (2B+) datapoints.
Both in real-time.
Visual Complexity Made Simple
LightningChart .NET and JavaScript intuitive APIs enable users to easily manipulate even the most complex charts with a mouse and touchscreen interaction features for any desktop, mobile, and tablet device.
5-Star Customer Support
LightningChart .NET and JavaScript solutions have full-technical support for both free trial and subscription users.
Whether you need first-time guidance or lines of code, we are here to help!
Most popular .NET charting control
in Visual Studio Marketplace
25,000
TIMES INSTALLED
LightningChart .NET
visualizes up to
1,000,000,000,000
DATA POINTS
LightningChart JS
visualizes up to
2,000,000,000
DATA POINTS
More than
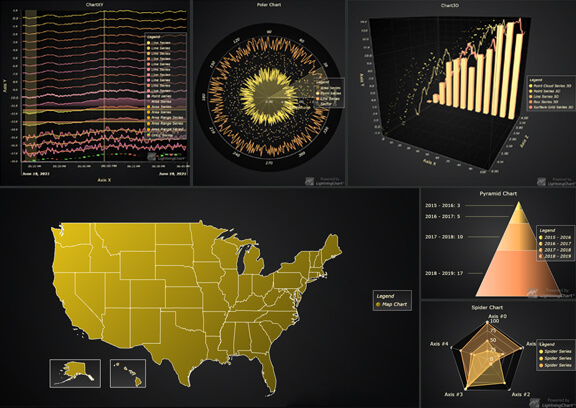
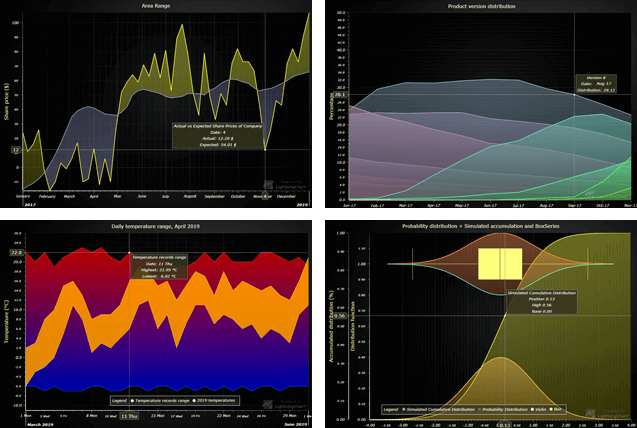
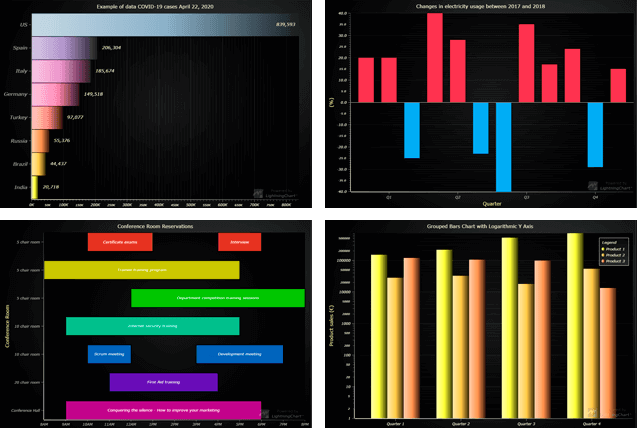
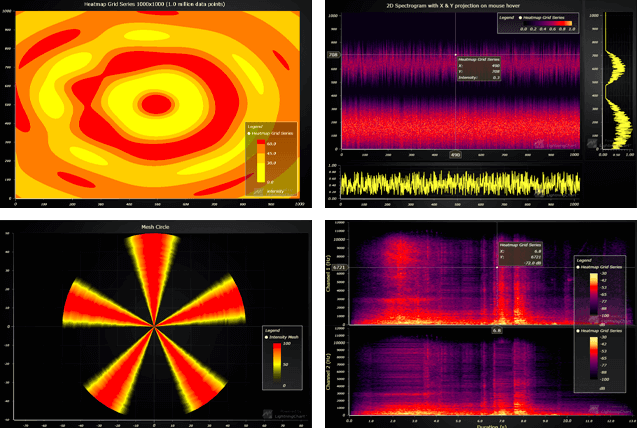
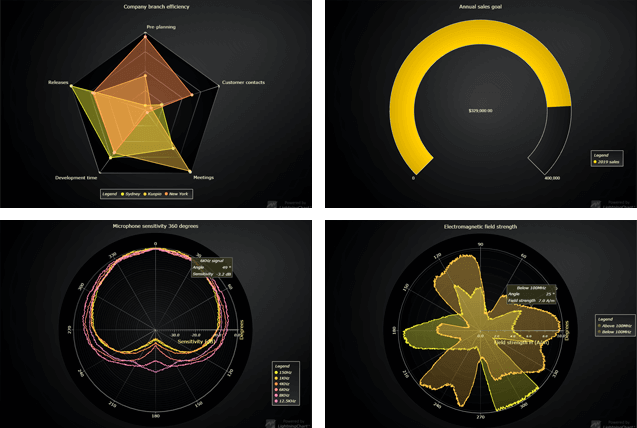
200 VISUALIZATION EXAMPLESUp to
1,000,000 TIMES FASTERTHAN OTHER LIBRARIES
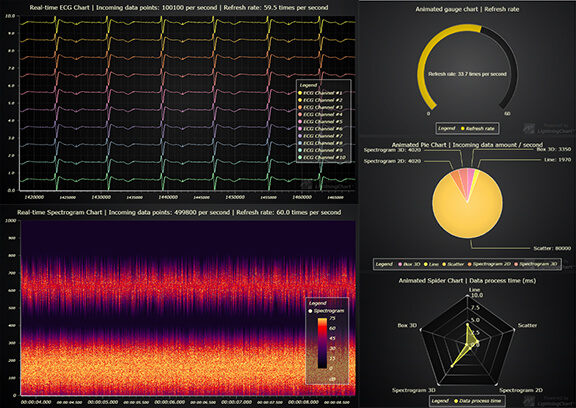
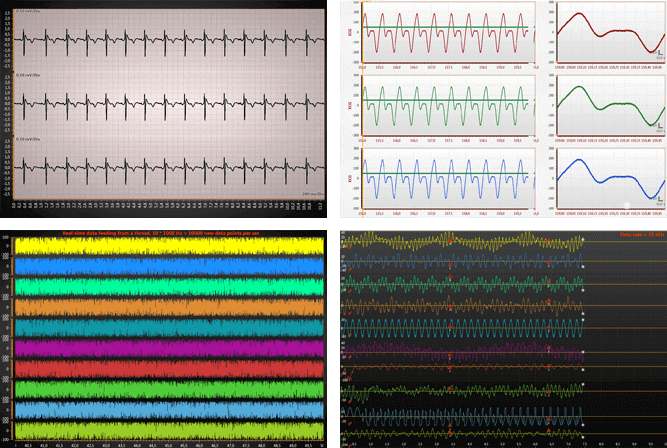
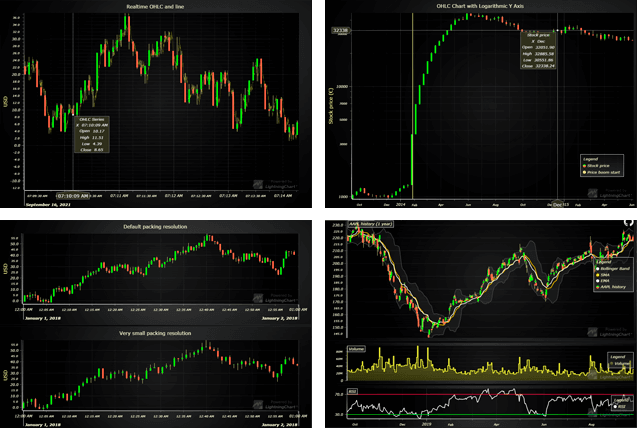
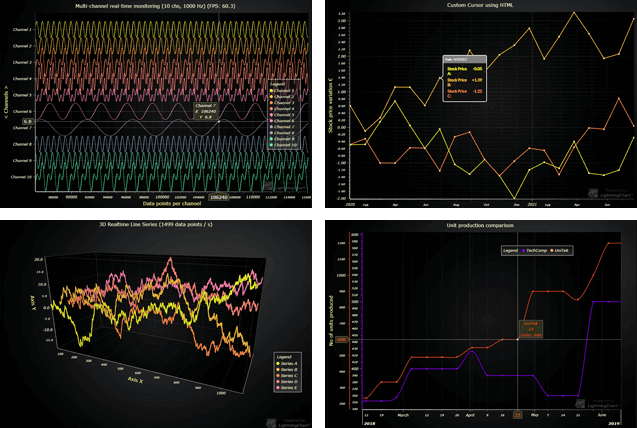
Real-time monitoring without flickering or delays
Full data accuracy, no reduction of data points needed
More data on screen
Better graphics quality
Responsive UI. The mouse or touchscreen operations will update the chart instantly and will free processor time for other UI controls to continue operating
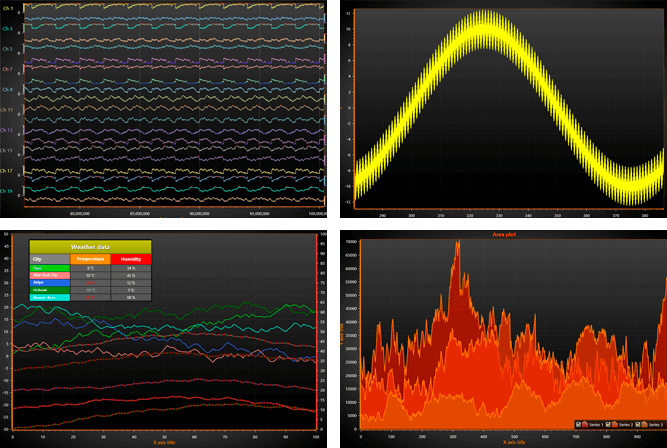

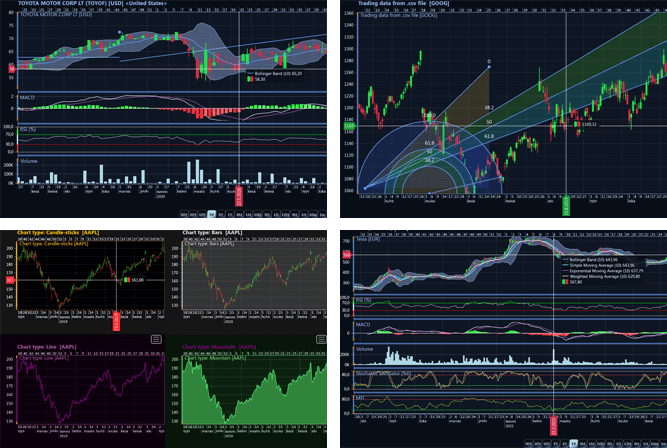

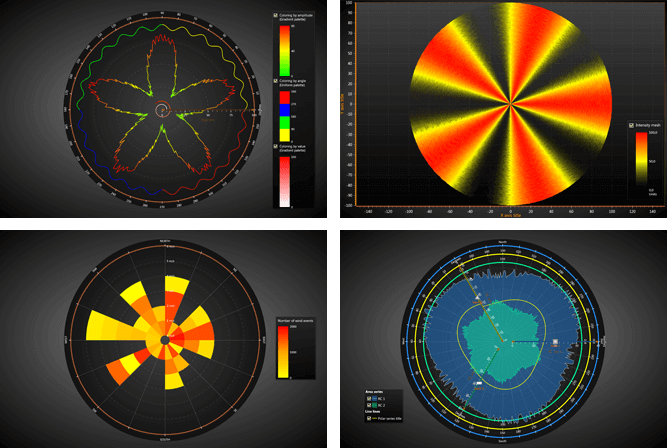

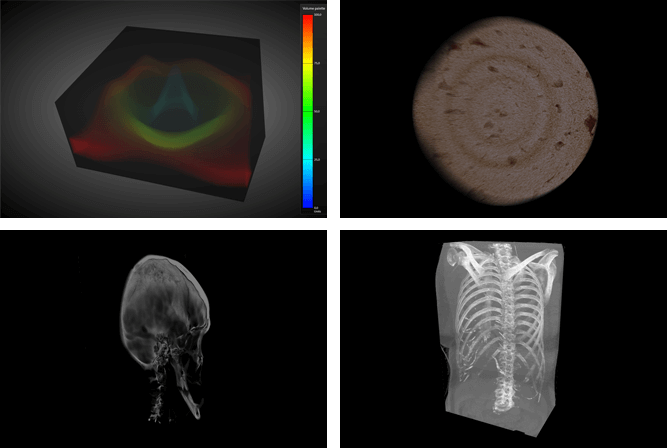
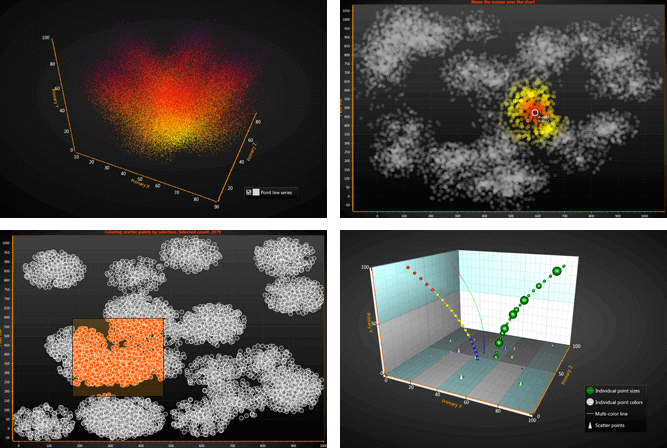
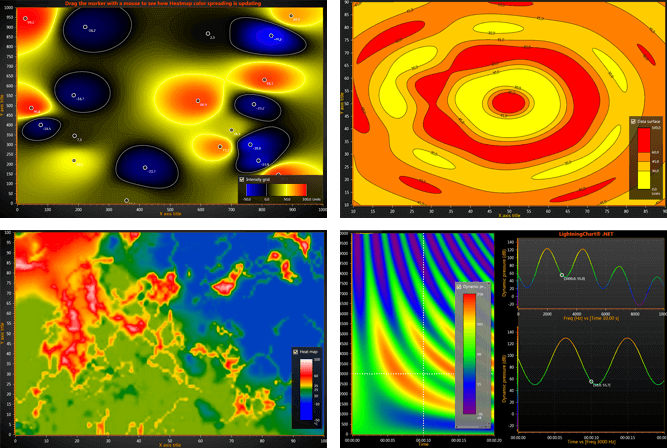


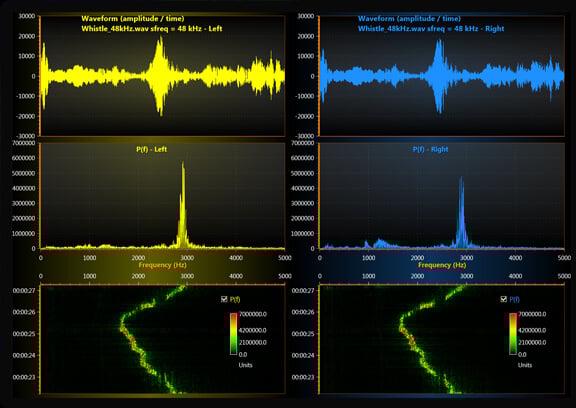
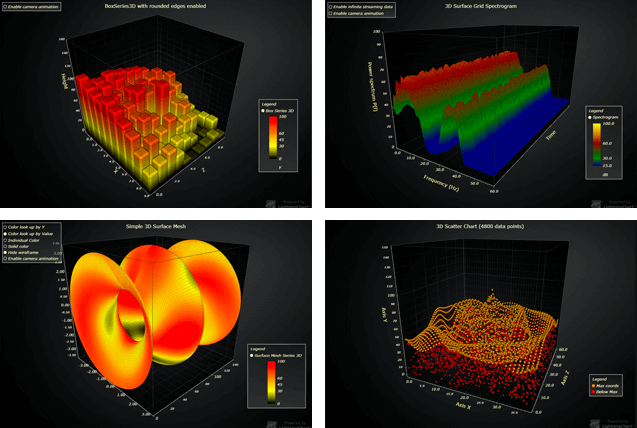
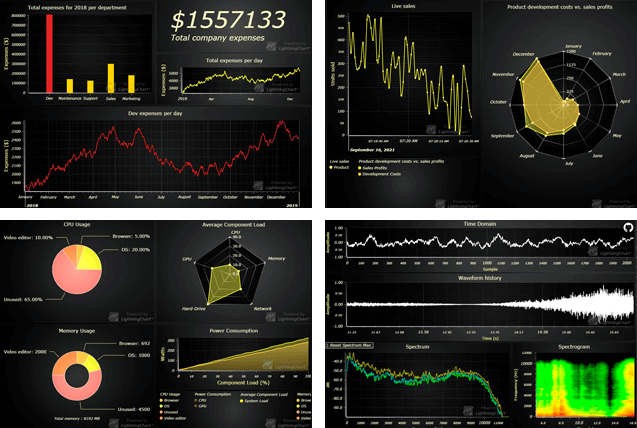
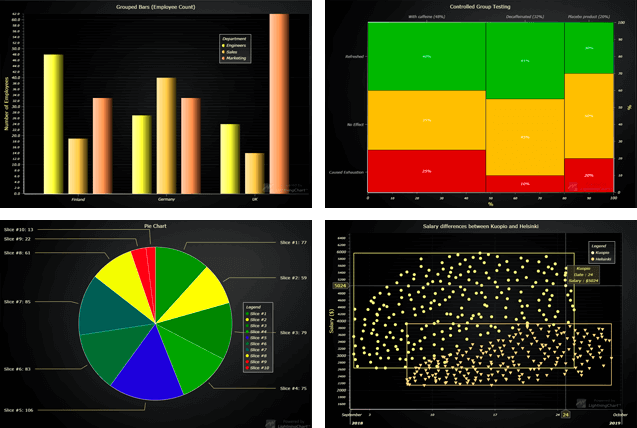
170+ Data Visualization types
Optimized for real-time data visualization and high-speed streaming data
Fully GPU-accelerated (WebGL)
Mouse and touchscreen with zooming and panning interactions
A dashboard to manage the layout and size of multiple charts


Customers Testimonials
“Using Arction LightningChart, we were able to deliver a Class III medical research system in under 9 months. Development was very quick thanks to their huge library of examples.”
Patrick Miller, Michael Hammann
“We are SOOO impressed with LC as it is really a product that greatly handles MASSIVE data in our real-time application. No delay nor choppy.”
Joel S
“LightningChart performs extremely well and real-time charts, heatmaps and 3D surfaces are the most advanced in the industry, IMO.”
S_Steph
“LC performance is simply outstanding. The WPF chart control is robust, mature, also very flexible and highly customizable. I personally recommend LightningChart for any data intensive application where no compromise in speed is the critical factor.”
Stefano Toniolo
“Their support is friendly, efficient and delivered by staff that clearly have a very high degree of competency. I would go so far as to say that in 25 years of working in the software industry, I have never found a more helpful and efficient third-party supplier.”
Tim Davey
“Its been a wonderful experience with LightningChart for us. We use it with large volume of data in Oil & Gas sector, and the visualization with LightningChart always meets our users performance expectations.”
Rajesh Bhairampally
“We are very satisfied with LightningChart’s performance. Despite its lightning-fast speed, we are amazed by the high quality of charts produced. What is worth to mention is their technical support: very responsive, fast and patient. The whole team has high professional knowledge and skills, which is why I am glad about the decision of choosing LightningChart.”
Shengsong Liang
“We’ve been using the WPF version of LightningChart for several years now, and we have never regretted this choice. We use it to visualize sound and vibration data in both 2D and 3D. The chart control is packed with features. It’s extremely fast, but also robust, very flexible and highly customizable. The product comes with a huge set of samples with source code, so getting started is easy. Good support is essential when buying a third party component, and the support given by LightningChart has really been outstanding. I will strongly recommend anyone looking for an advanced chart control to have a look at LightningChart!”
Geir Schjørlien
“Products developed with LightningChart are highly effective and exceed our customers’ expectations. Compared to other charting components, LightningChart shows significant advantages when presenting a huge amount of data. It allows to visualize and analyse data in a more intuitive way.”
Zhao Qichao
If you have any questions, feel free to contact us!